-
One Day to Go
Posted by Eddy Elfenbein on December 29th, 2011 at 6:21 pmWith one day to go, our Buy List is up 1.32% for the year to 0.43% for the S&P 500. Including dividends, our Buy List is up 3.18% to 2.55% for the S&P 500.
Unless something goes horribly wrong tomorrow, our Buy List will finish just ahead of the market. I’ll have more details tomorrow.
-
Is the 30-year Bull Market for Treasuries Already Over?
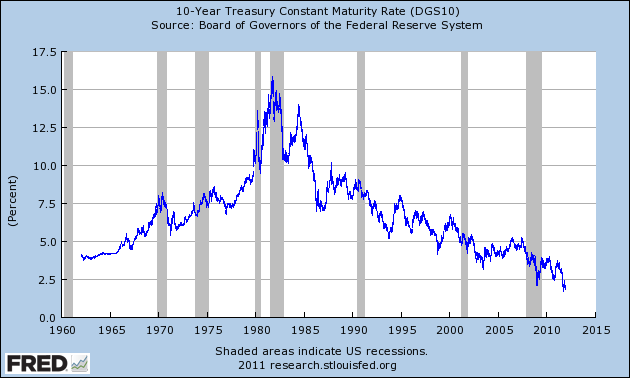
Posted by Eddy Elfenbein on December 29th, 2011 at 11:16 amI’m curious if the bond market passed an important and in fact, generational moment and few people realized it. We may look back at September 2011 as the peak of a 30-year bull market in U.S. Treasuries.
On September 16th, the one-, two- and three-year Treasuries yielded, respectively, 0.08%, 0.16% and 0.29%. Those were the lowest yields for those securities in decades.
Three days later, on September 19th, we saw generational lows in the five-, seven, 10-, and 20-year Treasuries. The respective yields were 0.79%, 1.24%, 1.72% and 2.48%. (The 30-year T-bond deserves a slight asterisk because it reached it lowest yields in late 2008.)
Of course, Mr. Bernanke and his friends have been aiding the latest surge into bonds, but let’s add some context. Almost 30 years to the day before, the 10-year hit its peak yield. On September 30, 1981, the ten-year yielded 15.84%.
Last week, the 20-year TIPs yield dropped to 0.43%. In February, it was going for 2%. The 10-year TIPs is still slightly negative.
I don’t expect to see dramatically higher yields in 2012, but it makes sense to see yields rise. Investing in Treasuries has been a winning trade for so long that I think investors may have forgotten that it doesn’t always go this way.
-
Morning News: December 29, 2011
Posted by Eddy Elfenbein on December 29th, 2011 at 7:23 amItaly Sells 7 Billion Euros of Bonds as Yields Fall
Italy’s Long-Term Borrowing Costs Decline
India to Exceed Its Record Borrowing Target
In Solar Power, India Begins Living Up to Its Own Ambitions
Tough India IPO Market Drives Deals Between Private Equity Funds
Putin’s Urals Ambitions Seen in Rotterdam Tanks
China Speeds Up QFII Approvals Amid Signs of Capital Outflow
Oil Prices Predicted to Stay Above $100 a Barrel Through Next Year
Retail Sales Resilient in Final Holiday Stretch
Global Takeovers Slump to Lowest in Year
Despite RIM Takeover Talk, Hurdles Would Be High
For IPOs, the Comeback Never Came
Mu Sigma: Is The Firm the New Wunderkind of Outsourcing?
Peugeot Joins Fiat in Sales Slump in Europe
Cavium Outlook Cut Sends EZchip to 8-Month Low
Morgan Stanley to Cut 580 Jobs in New York
Stone Street: Rolling Up Our Sleeves on Jos. A Bank
Roger Nusbaum: It’s The End of the World and Paul Farrell Knows It
Be sure to follow me on Twitter.
-
What Do You Like?
Posted by Eddy Elfenbein on December 28th, 2011 at 10:00 pmIn keeping with the refined, civilized and high-brow content of this website, I certainly hope you don’t find anything humorous in this clip.
I’m absolutely ashamed at you.
-
The Give and Take of Volatility
Posted by Eddy Elfenbein on December 28th, 2011 at 1:34 pmHere’s a look at all the daily changes of the S&P 500 over the last five years:
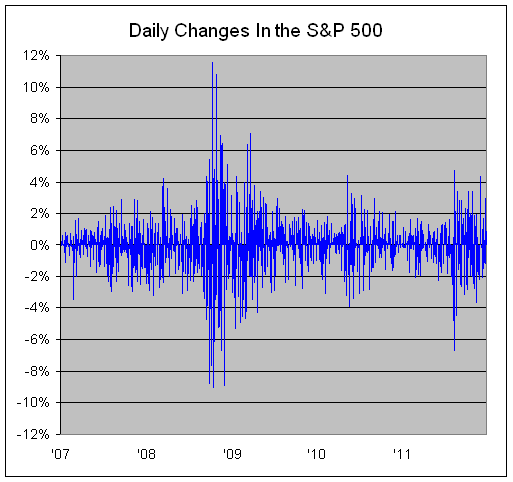
I’ve said before that volatility is used incorrectly as a scare word by many in the financial media. Volatility is rarely good or bad, especially if you’re focused on the long-term as we are. In fact, I prefer a little volatility since it helps us spot bargain stocks.
What the chart shows us — and what to keep in mind — is that volatility comes and goes. I’m not trying to sound flippant or dismissive; the numbers back it up.
We had very little volatility before the financial crisis; then we had historic volatility. Since then, volatility has flared up twice, once in the summer of 2010 and again last summer. That latest flare-up is still going, but I suspect it’s rapidly fading.
There wasn’t a single move, up or down, greater than 2.3% between September 2, 2010 and August 1, 2011. Since August 2nd, there have been 25 such moves. Like the others, this too shall pass.
I think the best way to look at volatility is as a struggle in the market for competing theses. The sharper the conflict, the greater the volatility. Once the market settles on a theme, then stability quietly returns.
-
The S&P and Sector P/E Ratios
Posted by Eddy Elfenbein on December 28th, 2011 at 1:01 pmHere’s a look at the S&P 500 plus the ten sectors along with their earnings estimates for next year and Price/Earnings Ratios.
Financials are still cheap but how much can we trust that earnings forecast?
Sector Earnings Est 12/27 Close P/E Ratio Discretionary 22.66 310.71 13.71 Staples 23.09 336.82 14.59 Energy 51.21 525.49 10.26 Financials 18.21 176.34 9.68 Health Care 35.27 404.12 11.46 Industrials 23.82 294.65 12.37 Technology 35.34 412.30 11.67 Materials 18.84 214.29 11.37 Telecom 7.68 129.33 16.84 Utilities 12.49 183.83 14.72 S&P 500 106.81 1,265.43 11.85 The Euro Flash Crash
Posted by Eddy Elfenbein on December 28th, 2011 at 10:29 amYikes. Check out what happened earlier today. The euro plunged to a 15-month low against the dollar.

Things Are Better Than You Think
Posted by Eddy Elfenbein on December 28th, 2011 at 10:25 amIn The Daily Beast, Zachary Karabell writes on a theme that we’ve been discussing recently — namely, that things are better than you might think. Given all the mayhem of the past 12 months, the U.S. economy has so far dodged all the predictions of its demise.
Make no mistake, the economy is far from strong. But compared to the rhetoric, we’re not that bad.
In the last months of 2011, every major indicator of economic health in the United States showed marked improvement: manufacturing, sentiment, holiday sales, e-commerce, inflation, and employment. Even government is shrinking, a fact that Republican candidates strenuously avoid and which Democrats uncomfortably skirt because it means large-scale government-employee layoffs; there are nearly 400,000 fewer government workers now than there were at the end of 2010. Yet there are more people employed overall. Wages have not increased for years but nor is income decreasing the way it was. In almost every way, the U.S. economy is stable, which is a far cry from robust and an equally far cry from dismal.
I always find it interesting that people get angry when you tell them there’s good news. Check out some of the loony comments below the column.
The New Buy List
Posted by Eddy Elfenbein on December 28th, 2011 at 8:52 amTo reiterate, here’s the Buy List for next year. This list will go into effect on Tuesday, January 3rd which is the first day of trading next year.
For tracking purposes, I assume the Buy List is a $1 million portfolio equally dividend into 20 positions of $50,000 each based on the closing price of December 30, 2011.
AFLAC ($AFL)
Bed, Bath & Beyond ($BBBY)
CR Bard ($BCR)
CA Technologies ($CA)
DirecTV ($DTV)
Fiserv ($FISV)
Ford ($F)
Harris ($HRS)
Hudson City Bancorp ($HCBK)
Johnson & Johnson ($JNJ)
Jos. A. Bank Clothiers ($JOSB)
JPMorgan Chase ($JPM)
Moog ($MOG-A)
Medtronic ($MDT)
Nicholas Financial ($NICK)
Oracle ($ORCL)
Reynolds American ($RAI)
Stryker ($SYK)
Sysco ($SYY)
Wright Express ($WXS)
J&J Breaks $66
Posted by Eddy Elfenbein on December 28th, 2011 at 8:48 amThe big European news story today was a major bond auction held in Italy and it went much better than feared, though people were fearing the worst. The Italian government sold nine billion euros’ worth of six-month debt. The rate was 3.25% which is a huge drop from last month’s auction at 6.5%.
The S&P 500 has been up for the last five trading days, and the futures are currently pointing towards a sixth rally. The market turned on October 3rd so the S&P 500 is looking to close out its best fourth quarter since 1999.
Although Abbott Labs ($ABT) will soon depart our Buy List, the stock just did a Jerome Simpson to a new 52-week high. Johnson & Johnson ($JNJ) which is an amazingly stable stock, is starting to drift higher. Yesterday, the shares closed above $66 for the first time in more than five months.
-
Archives
- September 2026
- August 2026
- July 2026
- June 2026
- May 2026
- April 2026
- March 2026
- February 2026
- January 2026
- December 2025
- November 2025
- October 2025
- September 2025
- August 2025
- July 2025
- June 2025
- May 2025
- April 2025
- March 2025
- February 2025
- January 2025
- December 2024
- November 2024
- October 2024
- September 2024
- August 2024
- July 2024
- June 2024
- May 2024
- April 2024
- March 2024
- February 2024
- January 2024
- December 2023
- November 2023
- October 2023
- September 2023
- August 2023
- July 2023
- June 2023
- May 2023
- April 2023
- March 2023
- February 2023
- January 2023
- December 2022
- November 2022
- October 2022
- September 2022
- August 2022
- July 2022
- June 2022
- May 2022
- April 2022
- March 2022
- February 2022
- January 2022
- December 2021
- November 2021
- October 2021
- September 2021
- August 2021
- July 2021
- June 2021
- May 2021
- April 2021
- March 2021
- February 2021
- January 2021
- December 2020
- November 2020
- October 2020
- September 2020
- August 2020
- July 2020
- June 2020
- May 2020
- April 2020
- March 2020
- February 2020
- January 2020
- December 2019
- November 2019
- October 2019
- September 2019
- August 2019
- July 2019
- June 2019
- May 2019
- April 2019
- March 2019
- February 2019
- January 2019
- December 2018
- November 2018
- October 2018
- September 2018
- August 2018
- July 2018
- June 2018
- May 2018
- April 2018
- March 2018
- February 2018
- January 2018
- December 2017
- November 2017
- October 2017
- September 2017
- August 2017
- July 2017
- June 2017
- May 2017
- April 2017
- March 2017
- February 2017
- January 2017
- December 2016
- November 2016
- October 2016
- September 2016
- August 2016
- July 2016
- June 2016
- May 2016
- April 2016
- March 2016
- February 2016
- January 2016
- December 2015
- November 2015
- October 2015
- September 2015
- August 2015
- July 2015
- June 2015
- May 2015
- April 2015
- March 2015
- February 2015
- January 2015
- December 2014
- November 2014
- October 2014
- September 2014
- August 2014
- July 2014
- June 2014
- May 2014
- April 2014
- March 2014
- February 2014
- January 2014
- December 2013
- November 2013
- October 2013
- September 2013
- August 2013
- July 2013
- June 2013
- May 2013
- April 2013
- March 2013
- February 2013
- January 2013
- December 2012
- November 2012
- October 2012
- September 2012
- August 2012
- July 2012
- June 2012
- May 2012
- April 2012
- March 2012
- February 2012
- January 2012
- December 2011
- November 2011
- October 2011
- September 2011
- August 2011
- July 2011
- June 2011
- May 2011
- April 2011
- March 2011
- February 2011
- January 2011
- December 2010
- November 2010
- October 2010
- September 2010
- August 2010
- July 2010
- June 2010
- May 2010
- April 2010
- March 2010
- February 2010
- January 2010
- December 2009
- November 2009
- October 2009
- September 2009
- August 2009
- July 2009
- June 2009
- May 2009
- April 2009
- March 2009
- February 2009
- January 2009
- December 2008
- November 2008
- October 2008
- September 2008
- August 2008
- July 2008
- June 2008
- May 2008
- April 2008
- March 2008
- February 2008
- January 2008
- December 2007
- November 2007
- October 2007
- September 2007
- August 2007
- July 2007
- June 2007
- May 2007
- April 2007
- March 2007
- February 2007
- January 2007
- December 2006
- November 2006
- October 2006
- September 2006
- August 2006
- July 2006
- June 2006
- May 2006
- April 2006
- March 2006
- February 2006
- January 2006
- December 2005
- November 2005
- October 2005
- September 2005
- August 2005
- July 2005
 Eddy Elfenbein is a Washington, DC-based speaker, portfolio manager and editor of the blog Crossing Wall Street. His