-
Apple Misses?
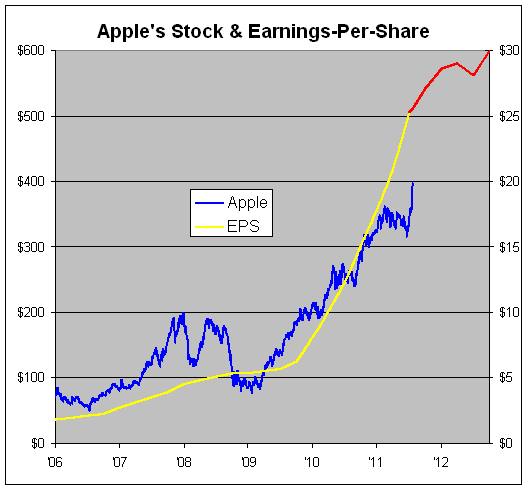
Posted by Eddy Elfenbein on October 18th, 2011 at 5:00 pmYes, it’s true. Apple ($AAPL) just reported third-quarter earnings of $7.05 per share which was 17 cents below estimates.
Of course, since Apple always beats the Street, investors were really expecting much more. There was even talk of Apple netting $8 or $8.50 per share. This is very surprising.
For the full fiscal year, which ended in September, Apple earned $27.68 per share which was a huge increase over the $15.15 earned in the year before.
Here’s a look at Apple and its EPS from a chart I made one month ago:
-
Earnings Season So Far
Posted by Eddy Elfenbein on October 18th, 2011 at 2:40 pmIt’s still early but we have some numbers on Q3 earnings.
Of the 500 companies in the S&P 500, 60 have reported so far. Of the 60, 41 have beaten estimates, 13 have missed and six have come inline.
Earnings are tracking for a result of $24.26 which is an increase of 7.4%. However, a few of the financial stocks have crowded the early part of the earnings season so the final figure should be much better. Wall Street expects earnings growth of 12.1% (that’s 14% when you exclude financials).
The bottom line: Earnings are still healthy. For now.
-
J&J Beats By Three Cents
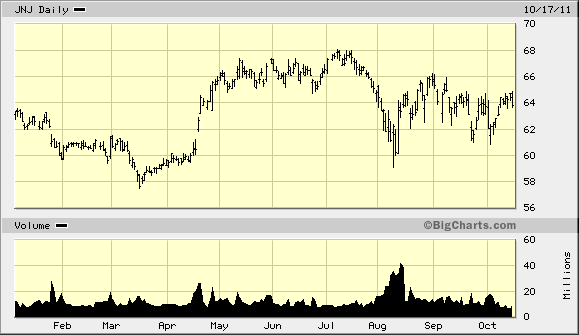
Posted by Eddy Elfenbein on October 18th, 2011 at 11:00 amGood news for Johnson & Johnson ($JNJ). The company reported Q3 earnings this morning of $1.24 per share which was three cents more than Wall Street’s consensus.
I said in the most recent CWS Market Review that I thought JNJ could deliver earnings of $1.25 per share, so I was off by one penny.
For the first three quarters of 2011, the company has already earned $3.87 per share. I also said last week that JNJ could raise each end of its quarterly guidance by five cents per share (it was at $4.90 to $5 per share). Again I was close — they raised the low end to $4.95 per share.
The WSJ has the 411:
Sales rose 6.8% to $16 billion, just short of the Thomson estimate of $16.02 billion. Favorable currency rates contributed 4.2 percentage points of the growth. U.S. sales dropped 3.7%, while non-U.S. sales rose 16.4%.
J&J’s biggest unit, medical devices and diagnostics, had sales of $6.3 billion, up 6% from a year earlier. Sales growth was helped by products for diabetes care, joint-replacement parts and surgical products. The cardiovascular care division continued to post sales decline due to diminished sales of drug-coated stent devices, a business J&J has decided to exit.
J&J expects to close its planned acquisition of Synthes in the first half of 2012, Mr. Caruso said.
J&J’s pharmaceutical unit sales increased 9% to $5.98 billion, with Remicade gaining 15%, HIV drug Prezista up 37% and cancer drug Velcade up 20%.
Sales of antibiotic Levaquin plunged 91% due to generic competition. U.S. sales of cancer drug Doxil dropped 87% due to a shortage caused by production problems at a contract manufacturer.
J&J’s consumer unit sales rose 5% to $3.74 billion, helped by baby-care, skin-care and oral-care products. Combined sales of over-the-counter medicines and nutritional products in the U.S. dropped 24% due to a series of recalls of OTC medicines stemming from manufacturing-quality lapses.
J&J said it expects to ship a limited supply of certain recalled OTC products later this year, and to reintroduce products throughout 2012.
The shares are down slightly so far but the stock currently yields close to 3.6%.
-
Morning News: October 18, 2011
Posted by Eddy Elfenbein on October 18th, 2011 at 5:34 amEuro Leaders’ Crash Crisis Campaign Bogs Down
France Risks Losing Top Grade on Bailout Fund
Chinese Company Scandals Are Spurring Due Diligence In HK -HK Exchanges Exec
Banks to Mimic Bank of America With New Fees
Farmers Facing Loss of Subsidy May Get New One
Energy Deals See an Upswing as Bargains Abound
Fed Officials at Odds on Inflation Threat
Citigroup and Wells Fargo Shares Fall on Lower Quarterly Revenue
Danone 3Q Sales Euro 4.81 Billion Vs. Euro 4.35 Billion; Confirms 2011 Targets
An Investor Creates a Tempest in a Coffee Cup
The Missed Red Flags on Groupon
Accounting Board Criticizes Deloitte’s Auditing System
Porsche Made in Leipzig Lowers Labor Costs
Joshua Brown: And the Men Who Hold High Places…
Paul Kedrosky: Traders Warn of Market Cracks
Be sure to follow me on Twitter.
-
The Current Mind of the Market
Posted by Eddy Elfenbein on October 17th, 2011 at 1:36 pmHere’s another table that explains the point I’ve been trying to make — namely that the stock market is currently being pulled in two different directions by competing theses.
On one hand, you have the view that everything’s fine and the market will rally higher. This will help the cyclical stocks plus the financials. On the other hand, you have the bearish view that only the defensive stocks will thrive.
As a result, each day we get one or the other. Either the financials lead a cylical rally, or the financials get pounded and the cyclicals swoon. The down days are generally worse than the up days.
The following table shows the average move of each S&P sector group based on the last 59 trading days (29 down, 30 up).
Sector Up Days Down Days Financials 2.15% -2.83% Industrials 1.84% -2.33% Materials 1.81% -2.41% Energy 1.79% -2.39% Discretionary 1.69% -1.92% Tech 1.59% -1.70% S&P 500 1.58% -1.92% Healthcare 1.24% -1.53% Telecom 1.00% -1.20% Utilities 0.97% -0.98% Staples 0.93% -1.04% This is the source of the market’s recent volatility. It’s not about risk. Instead, it reflects the market’s internal tug-of-war.
-
Breaking Down the Bear
Posted by Eddy Elfenbein on October 17th, 2011 at 11:42 amSince the market topped on April 29th, the S&P 500 has lost 10.2%. What’s interesting is that the losses have not been spread out equally. Here’s a look at the losses by each sector.
Utilities 2.50%
Staples -1.85%
Tech -1.85%
Discretionary -4.64%
Healthcare -6.66%
Telecom -7.32%
S&P 500 -10.20%
Energy -16.70%
Industrials -17.04%
Materials -17.22%
Financials -22.94%Outside of the Financials and the major cyclical groups, the market hasn’t been that bad.
Here’s an interesting stat: The Financials have been either the best- or worst-performing sector for 30 of the last 50 trading days. The Financials ended Friday also at exactly one-third of their all-time high (169.901 versus 509.553, a loss of 66.657%).
The Consumer Staples are only down 4.55% from their all-time high reached in May. The Techs are down 4.41% from a 10-year high (they still have a looong way to go to make an all-time high).
-
Bed Bath & Beyond Hits New 52-Week High
Posted by Eddy Elfenbein on October 17th, 2011 at 10:07 amThe stock market is down a bit this morning but we’re still holding on to most of the gains we made from Friday’s big push. The S&P 500 is currently down about 5.5 points.
The market is being helped by Citigroup’s ($C) earnings report which was quite good. The bank earned 84 cents per share which was two cents better than estimates.
Citi’s losses from bad loans fell 41 percent during the quarter to $4.5 billion as defaults fell from its credit card loans for Citi-branded cards. That allowed Citi to add $1.4 billion to its earnings from credit reserves it set aside for deeper losses.
The bank’s international consumer business increased 10 percent due to growth in Asia and Latin America. Its North American consumer business fell 9 percent from a year ago due mainly to lower average balances on its credit cards. Revenue in the card business also fell due to regulations that limit the ways banks can increase interest rates and fees.
Citi said its stock and bond trading business was hurt by uncertainty in financial markets due to the debt crisis in Europe and a downgrade of the U.S. government’s credit rating in August.
It could have been a lot worse. A lot. The shares are currently up about $1.
I was very impressed by the recent fall in the $VIX and I suspect that to continue. Earlier this year, the $VIX had dropped below 15 and I think that will happen again over the next few months.
On our Buy List, Bed Bath & Beyond ($BBBY) just broke out to another new 52-week high. The stock has been as high as $61.69 today.
The other good news is that the UAW rank-and-file seem to favor the recent deal with Ford Motor ($F).
UAW members at Ford went from voting 53 percent against the proposed contract on the morning of Oct. 14 to 62 percent in favor by yesterday at 8:30 p.m. New York time. The union said 14,845 members at Ford had cast ballots in favor of the labor deal while 9,076 voted against. Ford’s 40,600 U.S. hourly workers will conclude balloting tomorrow.
If the deal wasn’t approved, there was a chance that Ford could have faced its first nationwide strike in 35 years. One analyst said the strike would have cost Ford $71 million per day.
-
Morning News: October 17, 2011
Posted by Eddy Elfenbein on October 17th, 2011 at 5:14 amG-20 Gives EU One Week to Fix Debt Crisis
Bunds Fall, Wait for Policymakers to Deliver
Bankers Balk at EU Push for Bigger Greek Losses
Chinese Banks Increase Mortgage Rates as Property Prices Decline
Oil Rises to Highest in a Month on Europe Debt Rescue Efforts
Volcker Rule Divides Regulators
Ex-AIG CEO Greenberg Says U.S. Senate Bill on Yuan a ‘Dumb Idea’
Kinder Morgan to buy El Paso Corp. for $20.7 Billion
G4S Acquires ISS For GBP 5.2 Billion, Creating Giant
Amazon Signs Up Authors, Writing Publishers Out of Deal
BP Says Anadarko to Pay $4 Billion to Settle Gulf Spill Claims
Wal-Mart China Chief Resigns as Retailer Faces Pork Probe
Olympus Shares Plunge 24% Following Chief Ouster
Philips’ TV Deal at Risk, Plans 4,500 Job Cuts
Jeff Miller: WEIGHING THE WEEK AHEAD: ESCAPE FROM THE TRADING RANGE?
Howard Lindzon: Screw Diversification…and The Amazon Starve Wall Street Palooza
Be sure to follow me on Twitter.
-
S&P 500 = 1,224.58
Posted by Eddy Elfenbein on October 14th, 2011 at 4:29 pmAnother strong day! The S&P 500 closed at 1,224.58 today which is the highest close since August 3rd. The market is now up 11.4% since October 3rd.
This has been a pretty snappy run. Who knew October would be so good? The S&P 500 has now risen for seven of the past nine days. It’s 4.44% above its 50-DMA and we only need a push of 4.2% more to cross the 200-DMA.
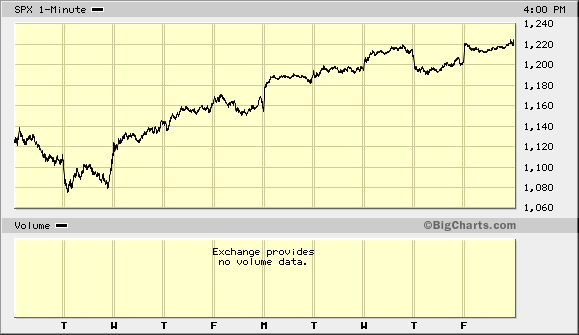
From the market top on April 29th to the October 3rd close, the S&P 500 lost 19.39%. The past nine days have basically cut that in half. We’re now 10.2% below our 2011 high.
Interestingly, October may be a popular time for market turns. Of course, there were the events of 1929 and 1987. But the market marked an important low on October 9, 2002 and it peaked exactly seven years later on October 9, 2007.
Perhaps October 3rd of 2011 marked another important low.
-
The VIX Breaks Below 30
Posted by Eddy Elfenbein on October 14th, 2011 at 12:16 pmMore evidence that the Fear Trade is unwinding. The Volatility Index ($VIX) just broke below 30.
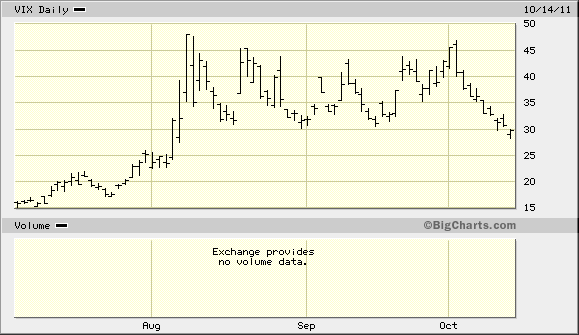
The VIX hasn’t closed below 30 since August 3rd.
-
Archives
- November 2026
- October 2026
- September 2026
- August 2026
- July 2026
- June 2026
- May 2026
- April 2026
- March 2026
- February 2026
- January 2026
- December 2025
- November 2025
- October 2025
- September 2025
- August 2025
- July 2025
- June 2025
- May 2025
- April 2025
- March 2025
- February 2025
- January 2025
- December 2024
- November 2024
- October 2024
- September 2024
- August 2024
- July 2024
- June 2024
- May 2024
- April 2024
- March 2024
- February 2024
- January 2024
- December 2023
- November 2023
- October 2023
- September 2023
- August 2023
- July 2023
- June 2023
- May 2023
- April 2023
- March 2023
- February 2023
- January 2023
- December 2022
- November 2022
- October 2022
- September 2022
- August 2022
- July 2022
- June 2022
- May 2022
- April 2022
- March 2022
- February 2022
- January 2022
- December 2021
- November 2021
- October 2021
- September 2021
- August 2021
- July 2021
- June 2021
- May 2021
- April 2021
- March 2021
- February 2021
- January 2021
- December 2020
- November 2020
- October 2020
- September 2020
- August 2020
- July 2020
- June 2020
- May 2020
- April 2020
- March 2020
- February 2020
- January 2020
- December 2019
- November 2019
- October 2019
- September 2019
- August 2019
- July 2019
- June 2019
- May 2019
- April 2019
- March 2019
- February 2019
- January 2019
- December 2018
- November 2018
- October 2018
- September 2018
- August 2018
- July 2018
- June 2018
- May 2018
- April 2018
- March 2018
- February 2018
- January 2018
- December 2017
- November 2017
- October 2017
- September 2017
- August 2017
- July 2017
- June 2017
- May 2017
- April 2017
- March 2017
- February 2017
- January 2017
- December 2016
- November 2016
- October 2016
- September 2016
- August 2016
- July 2016
- June 2016
- May 2016
- April 2016
- March 2016
- February 2016
- January 2016
- December 2015
- November 2015
- October 2015
- September 2015
- August 2015
- July 2015
- June 2015
- May 2015
- April 2015
- March 2015
- February 2015
- January 2015
- December 2014
- November 2014
- October 2014
- September 2014
- August 2014
- July 2014
- June 2014
- May 2014
- April 2014
- March 2014
- February 2014
- January 2014
- December 2013
- November 2013
- October 2013
- September 2013
- August 2013
- July 2013
- June 2013
- May 2013
- April 2013
- March 2013
- February 2013
- January 2013
- December 2012
- November 2012
- October 2012
- September 2012
- August 2012
- July 2012
- June 2012
- May 2012
- April 2012
- March 2012
- February 2012
- January 2012
- December 2011
- November 2011
- October 2011
- September 2011
- August 2011
- July 2011
- June 2011
- May 2011
- April 2011
- March 2011
- February 2011
- January 2011
- December 2010
- November 2010
- October 2010
- September 2010
- August 2010
- July 2010
- June 2010
- May 2010
- April 2010
- March 2010
- February 2010
- January 2010
- December 2009
- November 2009
- October 2009
- September 2009
- August 2009
- July 2009
- June 2009
- May 2009
- April 2009
- March 2009
- February 2009
- January 2009
- December 2008
- November 2008
- October 2008
- September 2008
- August 2008
- July 2008
- June 2008
- May 2008
- April 2008
- March 2008
- February 2008
- January 2008
- December 2007
- November 2007
- October 2007
- September 2007
- August 2007
- July 2007
- June 2007
- May 2007
- April 2007
- March 2007
- February 2007
- January 2007
- December 2006
- November 2006
- October 2006
- September 2006
- August 2006
- July 2006
- June 2006
- May 2006
- April 2006
- March 2006
- February 2006
- January 2006
- December 2005
- November 2005
- October 2005
- September 2005
- August 2005
- July 2005
 Eddy Elfenbein is a Washington, DC-based speaker, portfolio manager and editor of the blog Crossing Wall Street. His