Author Archive
-
CWS Market Review – September 14, 2021
Eddy Elfenbein, September 14th, 2021 at 7:17 pm(This is the free version of CWS Market Review. If you like what you see, then please sign up for the premium newsletter for $20 per month or $200 for the whole year.)
The August Inflation Report
The August inflation report came out this morning, and the evidence tells us that inflation is cooling off. If this trend continues, then the Federal Reserve will have been vindicated and inflation was, indeed, transitory.
Let me caution you that we’re not out of the inflation woods just yet, but the numbers we got this morning are encouraging.
In the report, the Bureau of Labor Statistics said that consumer prices rose by 0.27% last month. That was below expectations. While that’s not ideal, it’s a lot better than the numbers we saw in the five prior months. In July, inflation rose by 0.47% and the month before that, it was up by 0.90%. These were some of the highest numbers we’ve seen in decades.
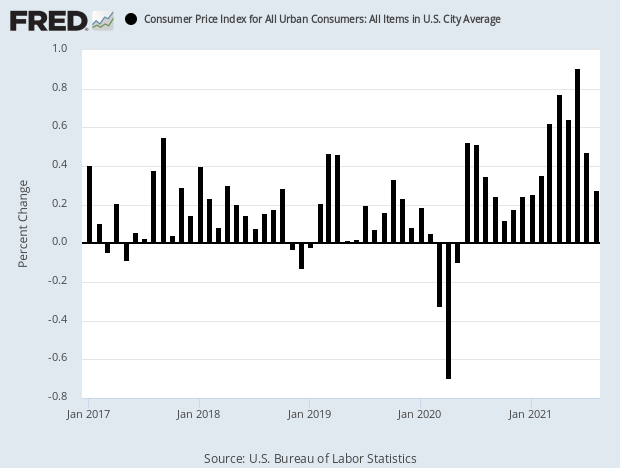
If we look at core inflation, which strips out volatile food and energy prices, then inflation was up just 0.10% last month. Compare that to June when core prices rose by 0.88% or to April when core inflation reached 0.92%. That was its highest rate in 40 years.
Over the trailing 12 months, the numbers are still unpleasant as they include the ugly April-to-July period. Over the last year, headline inflation was up 5.20% while core inflation increased by 3.98%. Expect these to gradually drift lower.
This has been a good reminder for investors that when in doubt, pay attention to the bond market. James Carville, President Clinton’s advisor, famously said that if he were to be reincarnated, he would want to come back as the bond market because “you can intimidate everybody.”
While we’ve seen scary headlines and some alarming data about inflation, the bond market has been indifferent. The yield on the 10-year Treasury peaked at 1.76% in February. It’s been trending down most of the time since. In fact, the scarier the headlines, the more the bond market has ignored it.
What does the inflation report mean for investors? Overall, this is good news for a few reasons. I still think it’s likely that the Federal Reserve will start to pare back its massive bond buying before the end of the year, but any rate hike is still a long way off. (By the way, the Fed meets again next week.)
I like to look at the futures market to see what traders think. Unlike economists, they have skin in the game. Even by July 2022, the futures market thinks there’s a 10% chance that the Fed will have raised rates by then. In other words, that’s 10 more months of 0% interest rates.
Stock Returns and Real Yields
I’ve been particularly impressed by the very, VERY low yield on the 10-year TIPs. By this, I mean the yield on the “Treasury Inflation-Protected” bonds. It’s now at -1.05%. That’s the yield adjusted for inflation, also known as the real yield.
Tracking how the stock market performs relative to the real yield is very revealing. I suspect that this may become a more common topic in the future because the issue gets to the heart of stock valuation.
If someone says that the stock market is cheap or expensive, naturally you need to ask, compared to what? For judging stocks, the 10-year Treasury yield is a good starting place. The problem with looking at Treasury yields is that inflation can greatly impact them. That’s where the TIPs come in because these bond yields are adjusted for inflation.
Treasuries are, of course, less risky than stocks. So if real yields are going for 3% or 4%, it may make sense to ditch your stocks and hang out in bonds. Conversely, if real yields are low, or even negative, it’s like an open invitation to buy stocks.
What does the data have to say? I went to the St. Louis Fed’s economic database (an invaluable resource). I downloaded all the daily closings for the 10-year TIPs yield which goes back to 1983. I also downloaded all the daily total returns for the Wilshire 5000 stock index. That’s the broadest measure of the stock market.
I found that if you take all the days collectively when the 10-year TIPs has yielded 1.67% or higher, then you see that the stock market had a negative return. Stocks were a net money loser.
But when the TIPs yield has been 0.00% or lower, then the stock market has delivered an average return of more than 38% per year. This makes sense, but seeing the numbers is still surprising.
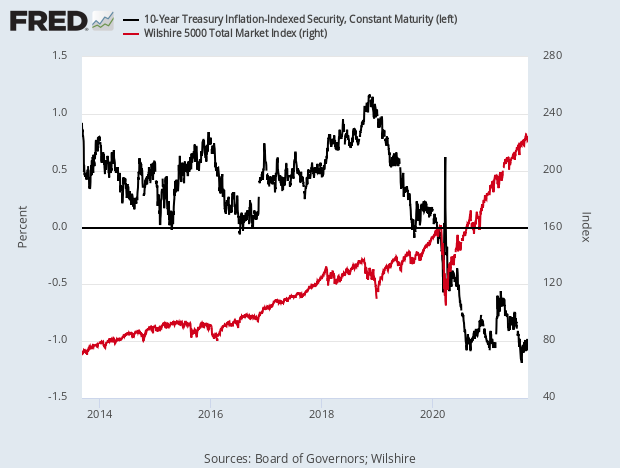
In short, the higher the TIPs yield, the worse it is for stocks. The lower the TIPs yield, the better it is for stocks. Nothing more complicated than that.
The TIPS tipping point seems to be at 0.5%. Anytime the yield on the 10-year TIPs is 0.5% or greater, then the stock market has delivered an annualized return of 5.1%. That’s probably less than the return of the TIPs bonds. But when the 10-year TIPs yield is under 0.5%, then the stock market has delivered an annualized return of 23.3%.
As I said before, the current yield on the 10-year TIPs is -1.05%. That isn’t just low – it’s close to as low as it’s ever been. The 10-year TIPs yield hasn’t been positive in 18 months. For now, the bond market is signaling more good news for stocks.
Stock Focus: Paycom Software
This week’s featured stock is Paycom Software (PAYC). Paycom’s job is to make your human-resources department more manageable. This isn’t so easy in the modern business climate. HR departments have to deal with lots of government regulations on top of needs specific to their industries. That’s not so difficult for a large corporation, but the HR requirements for a small start-up can be a major headache. That’s where Paycom comes in.
Paycom describes itself as a “leading provider of comprehensive, cloud-based human-capital management solutions delivered as software as a service.” The company makes and sells software that lets companies easily hire, manage, train, and most importantly, pay their employees. The advantage that Paycom brings is that its software centralizes the whole process.
For example, consider the process of finding a new employee. This is a major decision for any young company. Paycom can help with every step of the process. That includes tracking interviews and background checks.
Once a new employee joins up, there’s more paperwork to deal with. The employee has to make decisions regarding health insurance and retirement savings. On top of that, there’s on-board training. Paycom streamlines the entire process. This saves a company money, and, just as importantly, it saves time. Paycom currently has over 30,000 clients, and they’re very popular with their clients. The company’s annual retention rate consistently exceeds 90%.
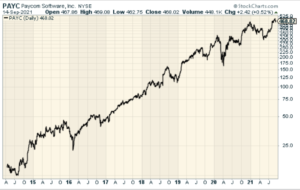
As this chart tells you, business has been good for Paycom:
Even after a new employee joins, Paycom still helps. Its software helps manage sick and vacation days as well as keeping track of training. Paycom provides functionality and data analytics that businesses need to manage the complete employment lifecycle, from recruitment to retirement.
Employees at customer firms love Paycom’s ease of use. Their software lets employees manage their own HR needs in the cloud, which reduces the administrative burden on employers and increases employee productivity.
This is a very lucrative sector. I project that Paycom’s earnings next year will be ten times what they were in 2015. This is one of the most innovative mid-cap stocks I can think of. You might assume that Paycom is another tech outfit based in Silicon Valley. Nope. Try Oklahoma City! But that shouldn’t be surprising. This is the world we live in today.
The company was founded in 1998, and it IPOed seven years ago. Paycom’s business has been growing at a rapid clip. Earnings-per-share jumped from 19 cents in 2014 to $3.49 last year. I think they’ll clear more than $4.40 per share this year and as much as $5.60 per share next year.

Last month, Paycom reported fiscal Q2 earnings of 97 cents per share. That topped estimates by 13 cents per share. Total revenues rose 33.3% to $242.1 million. Importantly, 98.1% of those revenues are recurring. That’s a very good sign.
Investors should also look at cash flow instead of focusing solely on earnings. For Q1, Paycom’s adjusted EBITDA, which is a measure of cash flow, came in at $87 million. That’s up from $61.2 million in the same period last year. Traders were impressed by the results. The stock jumped 11% after the earnings report.
Chad Richison, Paycom’s founder and CEO said, “The fundamentals of our business continue to strengthen, as demonstrated by our very strong second quarter results.”
For Q3, which ends in a little over two weeks, Paycom expects revenues between $249 million and $251 million, and EBITDA between $87 million and $89 million. For all of 2021, Paycom sees revenues of $1.036 billion to $1.038 billion, and EBITDA between $410 million to $412 million. The earnings report will be due out in early November.
I’ll caution you that Paycom is hardly a value stock, but its growth potential is very strong. Paycom is trading at 80 times my already optimistic forecast for next year.
This is an excellent company. I’m going to keep a close on eye it. If Paycom falls to $300 as it did this spring, it could be a welcome addition to our portfolio.
I’ll have more for you in the next issue of CWS Market Review.
– Eddy
P.S. If you haven’t had a chance, you can subscribe to our premium newsletter. It’s only $20 a month or $200 a year. Please join us!
-
Inflation Appears to Be Chilling Out
Eddy Elfenbein, September 14th, 2021 at 9:01 amThis morning we got the inflation report for August. The numbers look to be pretty good. The headline rate of inflation rose by 0.3%. The core rate, which excludes food and energy prices, rose by just 0.1%.
Over the past year, headline inflation has increased by 5.3% while core inflation is up by 4.0%.
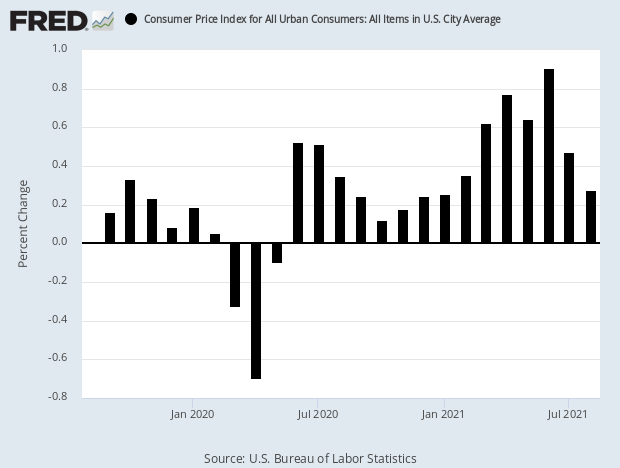
Here’s the monthly CPI data (headline rate, seasonally adjusted). So far, the rate of increase is falling. For now.
-
Morning News: September 14, 2021
Eddy Elfenbein, September 14th, 2021 at 7:03 amEU Seeks U.S. Alliance on Investor Screening to Confront China
In Argentina’s North, A ‘White Gold’ Rush for EV Metal Lithium Gathers Pace
Oil Hits 6-Week High as U.S. Gulf Braces for Storm Nicholas
Equities Have Little to Fear Now Fear Itself Has Made a Comeback
‘Inflation Guy’ Has Been Waiting Years to Tell You About the I-Word
High Meat Prices Are Helping Fuel Inflation, And A Few Big Companies Are Being Blamed
U.S. Solar Gets More Expensive in Threat to Climate Change Fight
A Plan to Hasten the Sale of Surplus Federal Property Gets Bogged Down
For Military Families, V.A. Loans Are a Lifeline, but With a Catch
NFTs Have Cathie Wood Excited: ‘This is How I Felt When the Internet Came About’
Intuit to Buy Mailchimp for $12 Billion
Apple Must Decide How Badly It Wants 30% Fee After Court Ruling
Apple Issues Emergency Security Updates to Close a Spyware Flaw
How China Evergrande’s Debt Troubles Pose a Systemic Risk
‘Lie Flat’ If You Want, But Be Ready to Pay the Price
Be sure to follow me on Twitter.
-
Late-Day Rally Saves Us from Six in a Row
Eddy Elfenbein, September 13th, 2021 at 4:47 pm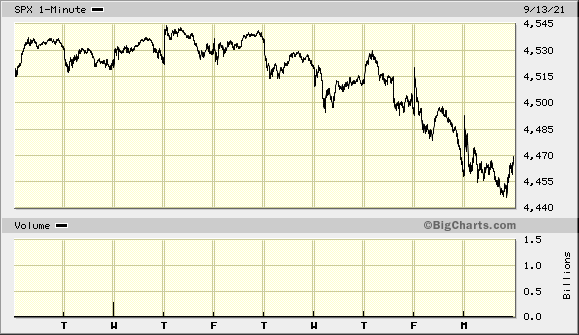
Thanks to a late-day rally, the S&P 500 avoided its sixth daily down day in a row. By the closing bell, the S&P 500 advanced 0.23%. A small gain, but we’ll take it. The next test for the market will be the inflation report which is due out tomorrow morning.
Today’s gains were heavily tilted toward energy stocks. The S&P 500 Energy index was up nearly 3% today. What’s interesting is that after so many years of lagging, the Energy Index no longer makes up much of the overall S&P 500.
Schlumberger was up about 5% while ExxonMobil closed higher by 2.5%. Many banks also did well. Outside of that, it was a pretty flat day. On our Buy List, Thermo Fisher Scientific (TMO), Trex (TREX) and Abbott Labs (ABT) made new 52-week highs.
For tomorrow’ inflation report, Wall Street expects a 0.4% increase for headline inflation and a 0.3% increase for core inflation.
-
Stocks Look to Snap Five-Day Losing Streak
Eddy Elfenbein, September 13th, 2021 at 9:57 amThrough Friday, the stock market fell for five days in a row. It’s up so far today, but it’s still early. The big news will come tomorrow when the government releases the inflation report for August.
Markets are on tenterhooks for critical U.S. inflation data that could buffet stocks and bonds if they shift expectations about Federal Reserve stimulus withdrawal and the timing of interest-rate hikes.
A backdrop of slower reopening in pandemic-stricken economies due to the delta strain, and price pressures stoked by supply snarls led to declines in both global stocks and Treasuries last week.
Some measures of producer prices released Friday topped expectations, with a gauge of final demand jumping 8.3% year-over-year amid persistent disruptions in supply.
The U.S. economy also has to deal with a rash of shortages. It seems like there are shortages of everything.
Shortages of metals, plastics, wood and even liquor bottles are now the norm.
The upshot is a world where buyers must wait for delivery of items that were once plentiful, if they can get them at all. Rash has piles of tents she can’t ship because she can’t get the right aluminum tubing for their frames, for instance, while others lack the right zippers.
Along with the shortages come hefty price increases, which has fueled fears of a wave of sustained inflation.
-
Morning News: September 13, 2021
Eddy Elfenbein, September 13th, 2021 at 7:05 amEl Salvador Runs a Bitcoin Scam
Britain Prepared for a Jobs Crisis, Just Not the One It Got
Wall Street Braced for ‘Far Stickier’ Inflation to Test Markets
One Sign That the Fed Changed Everything in Corporate Bonds
From Zippers to Glass, Shortages of Basic Goods Hobble U.S. Economy
In Social Policy Bill, Businesses See a Lot to Like. They Oppose It.
Green Steel Becomes a Hot Commodity for Big Auto Makers
Can A Green-Economy Boom Town Be Built to Last?
In Fresh Regulatory Move, China Tells Tech Giants to Stop Blocking Rivals’ Links
Evergrande 75% Haircut Is Now a Base Case for Bond Analysts
Alibaba Stock Tumbles After Report Says Beijing Wants to Break Up Alipay
Investors Panic as Blackstone Walks Away from a China Real Estate Deal
Kansas City Southern Chooses Suitor in Bid for North American Rail Link
To Survive the Pandemic, a Secret Nintendo Cafe Is Secret No Longer
Why Is PAC-12 Football So Awful? An Economic Progress Case For Its Demise
Racist Emojis Are the Latest Test for Facebook, Twitter Moderators
Be sure to follow me on Twitter.
-
Morning News: September 10, 2021
Eddy Elfenbein, September 10th, 2021 at 7:04 amAct Fast or Miss the Digital Payments Boat, BIS Tells Central Banks
‘The Lady Isn’t Tapering,’ Says Lagarde as ECB Slows Asset Purchases
‘Reversing Gears’: China Increasingly Rejects English, and the World
Deutsche Team Sees Risk of ‘Hard’ Equity Valuation Correction
Yes, Dow 36,000 Was Very Wrong
Cargo Congestion Worsens With More Ships Waiting to Enter U.S. Ports
Fed Officials’ Trading Draws Outcry, and Fuels Calls for Accountability
Skilled Workers Are Scarce, Posing a Challenge for Biden’s Infrastructure Plan
Businesses Question Logistics, Cost of Biden Vaccine Plan
Talent War May Drive Up Junior Banker Pay Even More, Says Moelis
Harvard’s $42 Billion Fund to Stop Investing in Fossil Fuels
Uber Eats, DoorDash, Grubhub Sue New York City Over Legislation on Commission Caps
Smart Glasses Made Google Look Dumb. Now Facebook Is Giving Them a Try.
DOJ Looking Into Conduct of Allianz Fund Managers
The CFA Route to Finance Is Cheap But Proving Very Stressful
In Slasher Film ‘Candyman,’ the Horror Is U.S. Housing Policy
Be sure to follow me on Twitter.
-
Morning News: September 9, 2021
Eddy Elfenbein, September 9th, 2021 at 7:02 amDid Bitcoin’s El Salvador Debut Dud Doom Crypto?
Bitcoin and Meme Stock Traders Are Tired of ‘Buying the Dip’
Traders Rush to Dump China Tech Stocks as Gaming Targeted Again
China Factory Inflation Surge to Add Pressure to Global Prices
It’s a Lehman Moment, Not Volcker, That China Should Fear
Top EU Court Gives Broad Protection to Term ‘Champagne’
Debt Ceiling, Meet Domestic Forever Wars
From 4% to 45%: Energy Department Lays Out Ambitious Blueprint for Solar Power
Investors Betting on ‘Stable’ Choice of Powell Renomination at Fed
Building A More Sustainable Car, From Headlamp to Tailpipe
Ford to End Manufacturing in India, Take $2 Billion Hit
Morgan Stanley Raises $3.1 Billion for Global Real Estate Bets
A Major Decision From The FDA Today Could Dramatically Reshape The Vaping Industry
How the Pandemic Turned Humble Shipping Containers into the Hottest Items on the Planet
Be sure to follow me on Twitter.
-
CWS Market Review – September 8, 2021
Eddy Elfenbein, September 8th, 2021 at 7:41 pm(This is the free version of CWS Market Review. If you like what you see, then please sign up for the premium newsletter for $20 per month or $200 for the whole year.)
What Happened to Value?
A few days ago, the great tweeter Ramp Capital, asked, “What useless talent would you like to have that you can’t profit from?”
Nate Geraci answered, “Value investing.”
Value investing
— Nate Geraci (@NateGeraci) September 5, 2021
I have to admit I laughed.
It’s sadly true. Value investing hasn’t been a very good strategy for the last several years. In fact, value investing has lagged the overall market for more than 14 years. The last value peak came in May 2007.
How could this be? When I was getting my MBA, we were all taught that value investing was one of the strategies that could beat the market over the long term. There are gobs of academic studies to back this up.
The idea is simple enough: Load up on stocks with low P/E Ratios or high dividend yields, sit back, wait and eventually count your winnings. It makes sense. Value stocks were stocks that were tossed aside by the market for whatever reason, so value investors simply profited from stocks regressing to the mean.
But what’s happened since 2007? To be precise, value investing has been unprofitable. It’s merely been less profitable than growth investing. To be sure, there have been periods of value lagging before. But that’s usually been two to three years. Nothing like 14. The current growth cycle will soon be old enough to get her learner’s permit.
Here’s a chart of the Vanguard Value ETF (VTV), in black, along with the Vanguard Growth ETF (VUG), in blue, since May 2007.
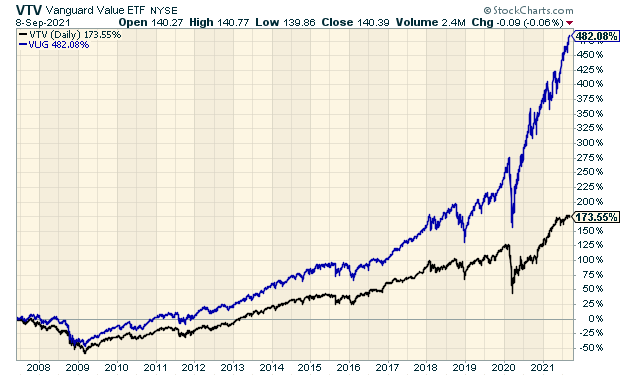
Yikes! So what happened to value? The answer is interesting because it’s not really about value. Instead, it’s about how we measure value. This is what happens when you blindly follow one metric without looking at the broader picture. The value indexes are made based on a stock’s price-to-book ratio. By book value, we mean the accounting value of the company.
But this isn’t a neutral factor. Not by a long shot. The book values of many financial and energy stocks are very elevated. As a result, lots of stocks are being mislabeled, in my opinion, as being value stocks.
For example, nearly every major bank has a book value that’s fairly close to 1.0. Not many are above 1.6. Citigroup’s (C) is just 0.79. This means that nearly every major financial company gets put in the value bin. The same is true for many energy companies, but that’s not how it should work.
Ideally, the relative performance of the value index should reflect investors’ appetite for risk. Now it’s simply an index that’s heavily slanted to large oil companies and the major banks. Banks haven’t done that well since the financial crisis and the price of oil peaked in 2008. The value indexes aren’t telling us that value has been weak. Instead, they’re just reflecting the changes happening in two sectors of the economy.
Let’s look at some numbers. The S&P 500 Value Index currently has a 21.1% weighting in financial stocks and a 5.2% weighting in energy stocks. Meanwhile, financial stocks make up just 2.8% of the S&P 500 Growth Index. Energy stocks are a scant 0.1%. Banks and financials have nearly ten times the weighting in value that they do in growth.
This is an important lesson in stock analysis. Effect A may not be caused by Factor A. Instead, the inputs can be all wrong and as a result, you’re getting bad outputs.
If I had my way, the value and growth indexes would not be determined by the particular accounting of different industry sectors. Instead, I would base them on how each stock behaves. If a stock broadly moves with other value stocks, then it’s a value stock. Same for growth. The judgment of the market is smarter than that of accountants.
Free Onions!
It’s time to free onions. By that, I don’t mean cost-free onions. Instead, I mean we should liberate onions!
In the United States of America, it’s against the law to trade onion futures. In 1958, Congress passed the Onion Futures Act. This sounds like something made up by a satirical newspaper, but it’s all true.
How did this law come to be? Well, that’s an interesting story.
**Eddy lights his pipe**
It started back in 1955. That’s when two onion traders, Sam Siegel and Vincent Kosuga, cornered the market for onions. Think Goldfinger, but onions instead of gold.
It turns out that there are many layers to this story. It’s a dicey situation and it may end in tears. (Sorry.)
Onion trading was actually a big deal years ago. It was one of the most popular contracts on the Chicago Mercantile Exchange. Siegel and Kosuga gradually bought millions of onions. They then shorted onion futures and dumped their vast onion horde on the market. The price for onions plunged. The price for a 50-pound bag of onions fell from $2.75 to just 20 cents. So many onions were going to Chicago that there were shortages in the rest of the country.
At one point, a 50-pound bag of onions was worth less than the bag that held them. As you might imagine, the public was not pleased. Siegel and Kosuga made millions. Meanwhile, farmers were crushed as they held vast amounts of worthless onions.
When the people get angry, that’s when politicians jump in. Congress passed the ban and President Eisenhower signed it into law. The bill was sponsored by Congressman Gerald Ford.
As a side note, the ban provided economists with a real-world arena to test an economic question: Does the presence of a futures market make the price of the underlying commodity more or less volatile? In other words, is speculation good or bad? Like many things economic, there’s conflicting data.
In recent years, onion prices have been very volatile. I think we’ll soon see onions futures return to the market.
(Yesterday, someone on Reddit wondered if their grocer’s coupon for onions violated the law. It doesn’t.)
Stock Focus: Reynolds Consumer Products
This week’s featured stock is Reynolds Consumer Products (REYN). I have to confess that I love consumer products companies.
I say this for several reasons.
The first is that these are often products consumers pretty much have to buy. Reynolds for example, makes Reynolds Wrap. Everyone has heard of it and nearly everyone uses it.
This is important because when the economy goes into a nose-dive, folks generally don’t cut back much on their household items. Instead, you’ll see broad weakness in areas like vacation-oriented businesses or homebuilders.
When the economy is on its knees, people cut back on the expensive stuff. Sales of Reynolds Wrap, not so much.
This is also important because we’ll witness steadier business performance. When looking at the financial statements of a consumer products company, we’ll probably see steady increases in sales, profits and dividends. This makes forecasting much easier, and that makes it easier for us to value a stock.
As a stock-picker, I’m always leery of companies that rely too much on “the promise” of future growth. With these defensive companies, there’s less guesswork.
Found in Nearly Every American Kitchen
First, let’s look at the back story of Reynolds Consumer Products. Reynolds’s products can be found in 95% of American kitchens. Open one drawer and you’ll see Reynolds Wrap and Reynolds Aluminum Foil. Look under the sink and there are the Hefty Bags. Look somewhere else and you’ll see paper plates and cups. Reynolds makes the stuff you usually don’t think about but would certainly miss if it wasn’t around.
Reynolds also does a nice business with “private labels.” In plainer terms, this means Reynolds also makes the store-brand knock-off stuff you see in the shopping aisles. The private label business usually does better during a recession, but Reynolds does well since they have both ends of the market covered.
Reynolds is also the exclusive private label supplier to Amazon.

Reynolds usually ranks #1 or #2 in just about every product segment. Most shoppers know the names and that helps brand loyalty. The company generates $3.2 billion in sales annually.
Who doesn’t love a red solo cup?
The company used to be part of Alcoa, but they were sold off to a private equity firm a few years ago. Reynolds then had its IPO in January of last year. This was before the coronavirus hit the U.S. economy and stock market.
The IPO was priced at $26 per share, and investors liked what they saw. On the first day of trading, the shares got as high as $29.46. Within a few days, they were on the doorstep of $32 per share. The rally soon ended as the economy went into lockdown and the shares plunged below $22.
That’s actually not so bad when you compare it to everyone else. When people get scared, they seek out quality.
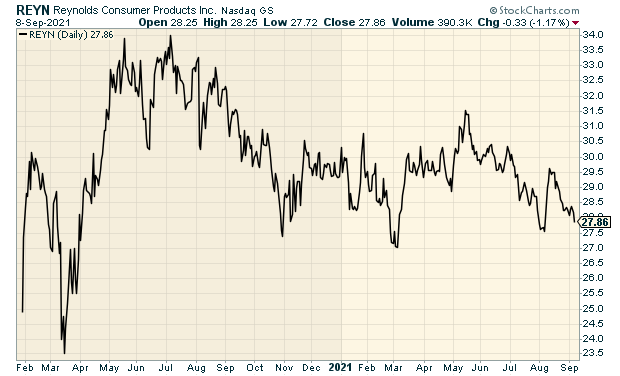
Pretty soon, Reynolds made back everything it lost and by early June, the stock made an all-time intra-day high of $36 per share. Since then, the stock has slowly drifted lower. When a good stock lags like this, it gets my attention.
Reynolds has already increased prices twice this year without any major problems. That’s a very good sign. In previous issues, I’ve talked about how the ability to raise prices is a good sign of having a competitive edge.
I also like that the company generates a lot of cash flow. One of my concerns is that the company carries a lot of debt. (That’s often a shady IPO strategy. The mother company shoves its debt onto the company they’re about to spin off.) While Reynolds does have a lot of debt, it can be managed; but it will take time and, of course, money. In fact, the company has already pared back its debt position.
Last month, Reynolds reported fiscal Q2 earnings of 39 cents per share on sales of $873 million. That topped estimates by one penny per share. Reynolds expects full-year earnings between $1.54 and $1.64 per share. That’s probably too low but only by a few cents per share. Reynolds pays a quarterly dividend of 23 cents per share. That works out to a yield of 3.30%.
There’s a lot I like about Reynolds Consumer Products. If the Q3 earnings report is good, REYN could be a member of our 2022 Buy List.
I’ll have more for you in the next issue of CWS Market Review.
– Eddy
P.S. If you haven’t had a chance, you can subscribe to our premium newsletter. It’s only $20 a month or $200 a year. Please join us!
-
Sherwin-Williams Lowers Guidance
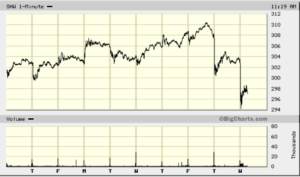
Eddy Elfenbein, September 8th, 2021 at 11:33 amThis morning, Sherwin-Williams (SHW) lowered its sales guidance for Q3. It’s actually not as bad as it sounds. Hurricane Ida took her toll. Also, rising prices are impacting SHW’s business. Importantly, Sherwin’s full-year sales and earnings guidance is unchanged.
Let’s get to the details. For Q3, Sherwin-Williams now expects sales to be “up or down by a low-single digit percentage over third quarter 2020.” The previous guidance was up mid-to-high single digits.
For the full-year, Sherwin sees sales up by “a high-single to low-double digit percentage.” For earnings, Sherwin still expects $9.15 to $9.45 per share.
“We continue to see strong demand across the pro architectural and industrial end markets we serve,” said Chairman, President and Chief Executive Officer, John G. Morikis. “However, persistent and industry-wide raw material availability issues have not improved as anticipated, impacting our ability to fully meet the strong demand. Raw material availability negatively impacted consolidated sales by approximately 3.5% in our second quarter, and we previously communicated that we anticipated less of an impact in the third quarter. We are now expecting raw material availability, including the unfavorable impact of Hurricane Ida, to negatively impact our third quarter consolidated sales by a high-single digit percentage.
“At the same time, our total cost basket, including raw materials, transportation and labor, continues to move upward. As a result of these increasing costs and in addition to the significant pricing actions we have already taken, we have announced a 4 percent surcharge in The Americas Group effective September 20 through the end of the year. We are confident in our ability to offset inflationary pressures, and we will continue to implement additional pricing actions across our segments over the remainder of this year and into next year as necessary. Our full year sales and diluted net income per share guidance remains unchanged, with full year 2021 adjusted diluted net income per share expected to increase 13.6% at the midpoint of the range compared to the prior year. We will provide an update on our full year outlook with our third quarter results on October 26, 2021.”
The shares are down some in today’s trading, but it’s not that bad.
-
Archives
- July 2026
- June 2026
- May 2026
- April 2026
- March 2026
- February 2026
- January 2026
- December 2025
- November 2025
- October 2025
- September 2025
- August 2025
- July 2025
- June 2025
- May 2025
- April 2025
- March 2025
- February 2025
- January 2025
- December 2024
- November 2024
- October 2024
- September 2024
- August 2024
- July 2024
- June 2024
- May 2024
- April 2024
- March 2024
- February 2024
- January 2024
- December 2023
- November 2023
- October 2023
- September 2023
- August 2023
- July 2023
- June 2023
- May 2023
- April 2023
- March 2023
- February 2023
- January 2023
- December 2022
- November 2022
- October 2022
- September 2022
- August 2022
- July 2022
- June 2022
- May 2022
- April 2022
- March 2022
- February 2022
- January 2022
- December 2021
- November 2021
- October 2021
- September 2021
- August 2021
- July 2021
- June 2021
- May 2021
- April 2021
- March 2021
- February 2021
- January 2021
- December 2020
- November 2020
- October 2020
- September 2020
- August 2020
- July 2020
- June 2020
- May 2020
- April 2020
- March 2020
- February 2020
- January 2020
- December 2019
- November 2019
- October 2019
- September 2019
- August 2019
- July 2019
- June 2019
- May 2019
- April 2019
- March 2019
- February 2019
- January 2019
- December 2018
- November 2018
- October 2018
- September 2018
- August 2018
- July 2018
- June 2018
- May 2018
- April 2018
- March 2018
- February 2018
- January 2018
- December 2017
- November 2017
- October 2017
- September 2017
- August 2017
- July 2017
- June 2017
- May 2017
- April 2017
- March 2017
- February 2017
- January 2017
- December 2016
- November 2016
- October 2016
- September 2016
- August 2016
- July 2016
- June 2016
- May 2016
- April 2016
- March 2016
- February 2016
- January 2016
- December 2015
- November 2015
- October 2015
- September 2015
- August 2015
- July 2015
- June 2015
- May 2015
- April 2015
- March 2015
- February 2015
- January 2015
- December 2014
- November 2014
- October 2014
- September 2014
- August 2014
- July 2014
- June 2014
- May 2014
- April 2014
- March 2014
- February 2014
- January 2014
- December 2013
- November 2013
- October 2013
- September 2013
- August 2013
- July 2013
- June 2013
- May 2013
- April 2013
- March 2013
- February 2013
- January 2013
- December 2012
- November 2012
- October 2012
- September 2012
- August 2012
- July 2012
- June 2012
- May 2012
- April 2012
- March 2012
- February 2012
- January 2012
- December 2011
- November 2011
- October 2011
- September 2011
- August 2011
- July 2011
- June 2011
- May 2011
- April 2011
- March 2011
- February 2011
- January 2011
- December 2010
- November 2010
- October 2010
- September 2010
- August 2010
- July 2010
- June 2010
- May 2010
- April 2010
- March 2010
- February 2010
- January 2010
- December 2009
- November 2009
- October 2009
- September 2009
- August 2009
- July 2009
- June 2009
- May 2009
- April 2009
- March 2009
- February 2009
- January 2009
- December 2008
- November 2008
- October 2008
- September 2008
- August 2008
- July 2008
- June 2008
- May 2008
- April 2008
- March 2008
- February 2008
- January 2008
- December 2007
- November 2007
- October 2007
- September 2007
- August 2007
- July 2007
- June 2007
- May 2007
- April 2007
- March 2007
- February 2007
- January 2007
- December 2006
- November 2006
- October 2006
- September 2006
- August 2006
- July 2006
- June 2006
- May 2006
- April 2006
- March 2006
- February 2006
- January 2006
- December 2005
- November 2005
- October 2005
- September 2005
- August 2005
- July 2005
 Eddy Elfenbein is a Washington, DC-based speaker, portfolio manager and editor of the blog Crossing Wall Street. His