Author Archive
-
Morning News: February 12, 2020
Eddy Elfenbein, February 12th, 2020 at 7:18 amAs Coronavirus Stifles China, Economic Logjams Build Worldwide
Tech Startups Are Flooding Kenya With Apps Offering High-Interest Loans
Powell Suggests the Fed May Lack Ammo to Combat Next Recession
FTC Expands Antitrust Investigation Into Big Tech
T-Mobile and Sprint Are Cleared to Merge as the Big Get Bigger
The Biggest Fan of Trump’s Steel Tariffs Is Suing Over Them
Business Is Worried About Bernie. Should It Be?
SoftBank Takes Another Multibillion-Dollar Hit From Bad Bets
Tiny Korean Hedge Fund Hits Jackpot With ‘Parasite’ Deal
Thyssenkrupp-Kone Merger Would Trigger Litigation War
Can A ‘Numbers Guy’ With Insurance DNA Finally Fix AIG?
American Way of School Funding Is ‘Uniquely Bad’ for Inequality
Nick Maggiulli: How Will Coronavirus Affect Your Portfolio?
Ben Carlson: Some Bull Market Reminders
Michael Batnick: The Secret of Stock Picking & The Good the Bad and The Ugly of American Borrowers
Be sure to follow me on Twitter.
-
Jerome Powell’s Testimony
Eddy Elfenbein, February 11th, 2020 at 10:26 amFed Chairman Jay Powell is testifying today before Congress. This is the Humphrey-Hawkins testimony. Today he appears before the House and tomorrow is the Senate’s turn.
Here’s a sample from his prepared remarks:
The economic expansion is well into its 11th year, and it is the longest on record. Over the second half of last year, economic activity increased at a moderate pace and the labor market strengthened further, as the economy appeared resilient to the global headwinds that had intensified last summer. Inflation has been low and stable but has continued to run below the Federal Open Market Committee’s (FOMC) symmetric 2 percent objective.
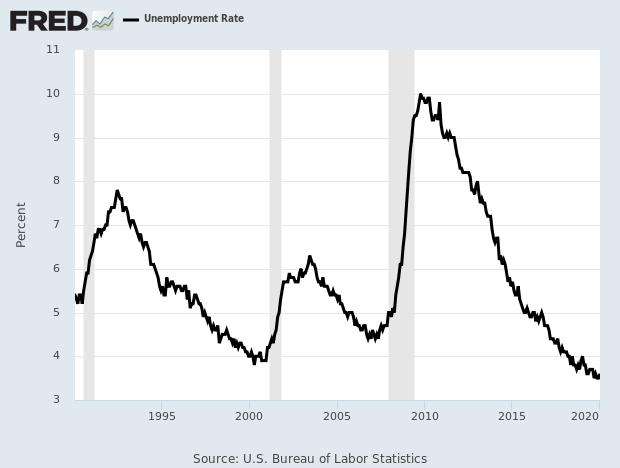
Job gains averaged 200,000 per month in the second half of last year, and an additional 225,000 jobs were added in January. The pace of job gains has remained above what is needed to provide jobs for new workers entering the labor force, allowing the unemployment rate to move down further over the course of last year. The unemployment rate was 3.6 percent last month and has been near half-century lows for more than a year. Job openings remain plentiful. Employers are increasingly willing to hire workers with fewer skills and train them. As a result, the benefits of a strong labor market have become more widely shared. People who live and work in low- and middle-income communities are finding new opportunities. Employment gains have been broad based across all racial and ethnic groups and levels of education. Wages have been rising, particularly for lower-paying jobs.
(…)
Taking a longer view, there has been a decline over the past quarter-century in the level of interest rates consistent with stable prices and the economy operating at its full potential. This low interest rate environment may limit the ability of central banks to reduce policy interest rates enough to support the economy during a downturn. With this concern in mind, we have been conducting a review of our monetary policy strategy, tools, and communication practices. Public engagement is at the heart of this effort. Through our Fed Listens events, we have been hearing from representatives of consumer, labor, business, community, and other groups.
The February Monetary Policy Report shares some of what we have learned. The insights we have gained from these events have informed our framework discussions, as reported in the minutes of our meetings. We will share our conclusions when we finish the review, likely around the middle of the year.
The current low interest rate environment also means that it would be important for fiscal policy to help support the economy if it weakens. Putting the federal budget on a sustainable path when the economy is strong would help ensure that policymakers have the space to use fiscal policy to assist in stabilizing the economy during a downturn. A more sustainable federal budget could also support the economy’s growth over the long term.The market is up so far this morning.
-
Morning News: February 11, 2020
Eddy Elfenbein, February 11th, 2020 at 7:10 amU.S. Hacking Charges Show China Trade Deal’s Unfinished Business
U.S. Companies Cut Back On Installing Robots in 2019
She Wants to Break Up Big Everything
What Money Flows and Mutual Funds Really Say About The Stock Market’s Future
Judge Is Said to Rule for T-Mobile Merger With Sprint
Judge Refuses to Block California’s Gig Worker Law During Suit
Amazon Wants To Depose Trump Over Losing $10 Billion ‘War Cloud’ Contract
Jeff Bezos’s Record $4.1 Billion Sale Ends Years of Restraint
Deutsche Bank Taps U.S. Tech Companies for Makeover
Mastercard Wins Approval to Join China’s $27 Trillion Market
Viral Chicken Sandwiches Aren’t Enough for Wall Street
Your Foam Coffee Cup Is Fighting for Its Life
Howard Lindzon: Momentum Monday – Stock Pickers Having Fun
Joshua Brown: Professor Galloway on Not Meeting People
Cullen Roche: American Living Standards Have Never Been Better
Be sure to follow me on Twitter.
-
Morning News: February 10, 2020
Eddy Elfenbein, February 10th, 2020 at 7:12 amThis Week in Business: Coronavirus Could Complicate Everything
Shipping Gets Smashed by Coronavirus in More Ways Than One
Hundreds of Chinese Firms Seek Billions in Loans Amid Coronavirus Outbreak
Need for Face Masks in China Pushes Auto, Energy Companies to Make Them
Apple Supplier Foxconn Restarts Key China Plant With 10% Workforce
Ransomware Attacks Grow, Crippling Cities and Businesses
He Combs the Web for Russian Bots. That Makes Him a Target.
Trump Forecasts Growth Above 3% This Year. Economists Disagree
Trump’s $4.8 Trillion Budget Would Increase Debt, Cut Safety Net
Family Builds $3.8 Billion Fortune, One Pint of Blood at a Time
There’s an Oil Man on JPMorgan’s Board. Climate Activists Want Him Out
This Bitcoin Bull Run Is Extremely Different To 2017’s Epic Rally
Michael Batnick: One More Thing
Roger Nusbaum: Not All Alts Are Created Equal
Ben Carlson: Some Thoughts on Young People Getting into Day-Trading & Is the Financial Media Too Negative?
Be sure to follow me on Twitter.
-
CWS Market Review – February 9, 2020
Eddy Elfenbein, February 9th, 2020 at 4:30 pm“Men, it has been well said, think in herds; it will be seen that they go mad in herds, while they only recover their senses slowly, and one by one.” – Charles Mackay
I have to apologize for the newsletter being late. I was at the Money Show in Orlando. I had a great time and got to meet some subscribers.
What an event-filled week this has been! Let’s see, we had the Super Bowl, the Iowa Caucus, the impeachment vote, the State of the Union, the coronavirus news, the January jobs report and on Thursday, an all-time closing high for the S&P 500.
In addition to all that, we had a bunch more Buy List earnings reports. In this issue, I’ll run down them all. We also had some strange news with Intercontinental Exchange. I’ll break it down for you. I’ll also preview next week’s earnings report from Moody’s.
But first, let’s look at Friday’s jobs report.
Another Strong Jobs Report
I normally send out the newsletter just ahead of the monthly report. Thanks to this week’s delay, I can cover the report, and it was another good one.
For January, the U.S. economy created 225,000 net new jobs. The warm weather helped. Wall Street had been expecting 158,000 new jobs.
The unemployment rate ticked up 3.6%. The labor force participation rate rose to 63.4%. That’s the highest in seven years.
The U-6 Rate, which is a broader measure of unemployment, rose to 6.9% which is still very low.
The soft spot continues to be wages. To be fair, there has been some growth here, but I’d like to see more. In the last year, average hourly earnings are up by 3.1%. That’s more than inflation, but not much more.
Since the coronavirus started spreading, the odds for a Fed rate cut have bumped up. In fact, the futures market saw one coming as early as June. However, thanks to these jobs numbers, there’s been some rethinking. That’s probably why the market pulled back on Friday. In other words, good news is bad news because the Fed may not step in and rescue the market.
Now let’s get to our many earnings reports.
Earnings from Church & Dwight and Broadridge Financial Solutions
Let’s start with the two earnings reports we had last Friday, January 31. We’ll start with the good news. Church & Dwight (CHD) said they earned 55 cents per share for Q4 which matched Wall Street’s estimate. C&D also bumped up their quarterly dividend from 22.75 cents to 24 cents per share. This is their 24th annual dividend hike in a row.
For Q1, C&D expects earnings of 73 cents per share. For all of 2020, the company is looking for earnings of $2.64 to $2.69 per share. That’s an increase of 7% to 9% over 2019. This week, I’m lifting our Buy Below to $80 per share.
Now for the bad. Broadridge Financial Solutions (BR) reported earnings of 53 cents per share. That was 18 cents below estimates.
What happened? On the earnings call, the CEO said, “Event-driven activity came in significantly below our expectations, leading to a 5% decline in adjusted EPS in a seasonally small quarter. We now expect a lower level of event-driven activity to persist into the second half of fiscal 2020.”
The company stood by its forecast for this fiscal year (ending in June) for EPS growth of 8% to 12%, although now they confess it will be “at the low end.” That range had worked out to $5.03 to $5.22 per share. Now let’s say it’s $5.03 to $5.10 per share.
The stock dropped 8% after the earnings report, but I’m going to keep our Buy Below at $130 per share.
Check Point Software Beats Earnings
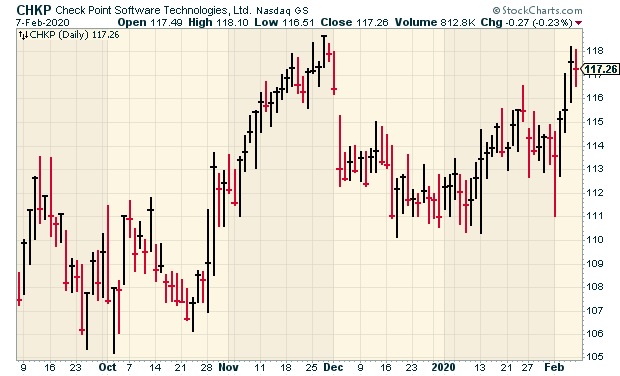
On Monday, Check Point Software (CHKP) reported Q4 earnings of $2.02 per share. That’s up from $1.68 one year ago. Check Point also beat estimates for $1.99 per share. Revenue rose 3% to $544 million which beat estimates of $542.5 million.
During Q4, Check Point bought back 2.9 million shares for $325 million. The company announced a $2 billion extension to the share buyback program. Check Point didn’t provide any guidance for 2020. I’m raising our Buy Below on Check Point to $125 per share.
Five Buy List Reports on Tuesday
Tuesday was an especially busy day with five Buy List earnings reports. Let’s start with Fiserv (FISV). For Q4, the company made $1.13 per share. That was a penny below expectations.
“2019 was a year of leadership and growth in which we took steps to transform an industry to better enable long-term, differentiated value for clients, associates and shareholders,” said Jeffery Yabuki, Chairman and Chief Executive Officer of Fiserv. “We delivered strong financial results including our 34th consecutive year of double digit adjusted earnings per share growth.” Fiserv earned $4.00 for 2019. The company sees 2020 earnings of $4.86 to $5.02 per share. I’m raising our Buy Below on Fiserv to $130 per share.
Cerner (CERN) made 75 cents per share for Q4. That beat by a penny. Cerner earned $2.68 per share for the year. For Q1, Cerner sees earnings of 69 to 71 cents per share. For 2020, they see $3.09 to $3.19 per share. That’s quite good. The stock gapped up 6% on Wednesday and made a new high. I’m raising our Buy Below to $85 per share.
Disney (DIS) had another blow-out quarter. The company has signed up 26.5 million Disney+ subscribers. For Q4, Disney made $1.53 per share. That was nine cents more than expectations.
The stock has been knocked around some lately due to concerns that their parks business will be hurt over fears of the coronavirus. Nevertheless, Disney’s business is doing just fine. I’m keeping my Buy Below at $152 per share.
AFLAC (AFL) earned $1.03 per share which beat estimates by one penny. Currency exchange added two cents per share. AFLAC also increased its quarterly dividend from 27 cents to 28 cents per share. This is their 37th annual dividend increase in a row.
I like the duck stock a lot. For 2020, AFLAC is looking for earnings of $4.32 to $4.52 per share. That assumes an exchange rate of 109.07 yen to the dollar (which was the average for 2019). That’s pretty conservative guidance, as I expected. AFLAC is a buy up to $57 per share.
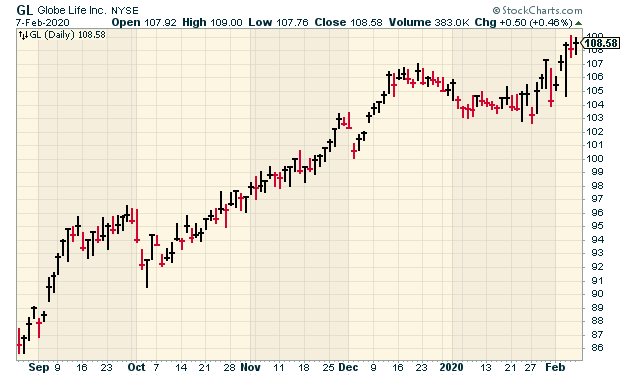
Globe Life (GL) may be our quietest stock but the insurance company just touched a new 52-week high. Globe Life had Q4 operating income of $1.70 per share. That was two cents below estimates, but guidance was pretty optimistic. For 2020, GL expects operating earnings of $7.03 to $7.23 per share. Wall Street had been expecting $7.18 per share. I’m raising our Buy Below to $115 per share.
Earnings from Becton, Dickinson and ICE
Two more reports on Thursday. Becton, Dickinson (BDX) was the dud this earnings season. The company actually beat earnings for Q3, $2.65 to $2.63 per share (the December quarter is BDX’s fiscal Q1). Currency-neutral earnings rose 2.5%. Tom Polen, the CEO, said, “In the first quarter, the BD team delivered solid results, in line with our expectations.”
The problem, however, is guidance. Three months ago, BDX gave us EPS guidance for this year of $12.50 to $12.65. The company now expects EPS between $11.90 and $12.10 per share. That’s a drop of 4.0% to 5.5% from last year.
The problem is that it will take the company longer to resolve the issues surrounding its Alaris infusion pump. Becton said it will work with the FDA and existing customers to work on a remediation plan.
Polen said: “As we look ahead to the balance of the fiscal year, we are focused on the resolution of the Alaris pump matter. We stand behind the safety of the Alaris System, which is used in the care of 70 percent of patients undergoing infusion therapy. Now, we need to take the necessary steps to meet the FDA’s expectations with respect to the Alaris System. We are committed to doing what is right for customers, patients and shareholders. You can expect that our purpose and values will always be at the core of who we are and how we work to resolve this situation moving forward.”
Shares of BDX fell 11.8% on Thursday. I’m dropping our Buy Below to $265 per share.
Intercontinental Exchange (ICE) certainly made a lot of news last week. The stock dropped 7.4% on Tuesday when The Wall Street Journal said ICE made an offer of more than $30 billion to buy eBay (EBAY), a former Buy List stock, by the way. Shares of eBay jumped on the news.
I was completely baffled by this news. Why would a stock-exchange company buy an online auction house?
Then, after the close on Thursday, ICE said actually, no they’re not in talks to buy eBay. Well, that was a relief!
Also on Thursday, ICE reported Q4 earnings of 95 cents per share. That matched expectations. I like to watch ICE’s data revenue. For Q4, that came in at $559 million which is about what I expected.
ICE also hiked its dividend by 9% to 30 cents per share. ICE remains a buy up to $100 per share.
Earnings Preview for Moody’s
Moody’s (MCO) will report its Q4 earnings on Wednesday, February 12. The ratings agency is already our #1 stock this year with a gain of 12.7%. Three months ago, Moody’s beat estimates by 15 cents per share. The key to Moody’s success is its Moody’s Analytics segment. Revenue there was up 13% last quarter.
The Q3 results were so good that Moody’s raised its full-year EPS guidance to $8.05 to $8.20. The previous guidance had been $7.95 to $8.15 per share. The shares touched a new high on Thursday. Moody’s has doubled for us in less than 14 months.
That’s all for now. The coming week should be much quieter. One big item will be Fed Chairman Jerome Powell’s testimony before Congress on Tuesday and Wednesday. Also on Wednesday, the next CPI report is due out. I’ll be curious to see if there was any significant inflation during January. Then on Friday, we’ll see the retail-sales report for January. Be sure to keep checking the blog for daily updates. I’ll have more market analysis for you in the next issue of CWS Market Review!
– Eddy
-
Another Good Jobs Report
Eddy Elfenbein, February 7th, 2020 at 9:32 amFor January, the U.S. economy created 225,000 net new jobs. The labor force participation rate is 63.4%. The unemployment rate ticked up 3.6%.
Over the last year, average hourly earnings are up by 3.1%. The broader unemployment rate is 6.7%.
-
Newsletter Delay
Eddy Elfenbein, February 7th, 2020 at 8:55 amI’m at the Orlando Money Show which will cause a slight delay for the newsletter. I hope to have it for you by this weekend.
-
Morning News: February 7, 2020
Eddy Elfenbein, February 7th, 2020 at 7:05 amCredit Suisse CEO Thiam Ousted After Losing Boardroom Battle
A Rare Online Revolt Emerges in China Over Death of Coronavirus Whistle-Blower
Majority of U.S. Firms in China See Revenue Hit From Coronavirus
The Biggest Threat to Space Commerce is the Sun
Blue Collar Boom? College Grads, Baby Boomers Big Winners in Trump’s Economy
Really? Is the White House Proposing to Buy Ericsson or Nokia?
Social Security: Where Do The 2020 Candidates Stand?
U.S. Payroll Gains Seen Picking Up, Benchmark Revisions Under Spotlight
PG&E Has a Survival Plan, and Newsom Has Plan B: A Takeover
Casper Sleep Shares Rise 13% in First Day of Trading
T-Mobile Beats Quarterly Estimates as Sprint Merger Decision Looms
Put Your Smaller Bonus to Better Use on Things That Will Appreciate
Howard Lindzon: Tesla Tesla Tesla…Nasdaq 10,000 Is So Close!
Ben Carlson: Simple vs. Complex, 2019 Edition
Joshua Brown: You’d Be Amazed at How Many Investors Start Off Without Even a Return Goal in Mind, What Are Your Thoughts: YouTube Revenues, Amazon Prime Subs, Etc. & Greatest Short Squeeze of All Time?
Be sure to follow me on Twitter.
-
Morning News: February 6, 2020
Eddy Elfenbein, February 6th, 2020 at 7:11 amChina to Halve Tariffs On Some U.S. Imports As Virus Risks Grow
U.S. Jobs Report to Contrast Healthy 2020 Start With Weaker Past
The Super Bowl’s Real Winner Was … Bill Murray?
China’s Mobile Giants to Take on Google’s Play Store
Google Maps Seeks Business, Transit Reviews In New Look As It Turns 15
Child-Welfare Activists Attack Facebook Over Encryption Plans
Facial Recognition Moves Into a New Front: Schools
A Small Rocket Maker is Running a Different Kind of Space Race
SARS Cost Global Airlines $7 Billion. The Coronavirus Outbreak Will Likely Be Much Worse
BP Eyes Sale of Algerian Gas Plant After Rosneft Talks Fail
Jeff Carter: Buying Marketplaces
Ben Carlson: Will Retiring Baby Boomers Crash the Stock Market?
Michael Batnick: Animal Spirits: Do Economies Need to Go Bust?
Cullen Roche: Why is Shorting Stocks so Difficult?
Be sure to follow me on Twitter.
-
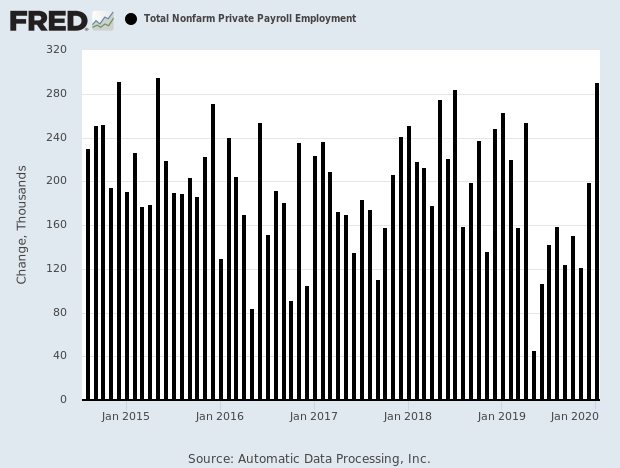
The Best ADP in Nearly Five Years
Eddy Elfenbein, February 5th, 2020 at 12:50 pmThe S&P 500 is up again today and it’s close to a new all-time high. The Nasdaq Composite is at a new high.
This morning, the ADP payroll report was very strong. It was the best report in nearly five years (see below). We’ll get the official government jobs report on Friday.
Also this morning, the ISM Non-Manufacturing Index increased to 55.5. That’s the highest since August.
We had five earnings reports after yesterday’s close. This morning, both Disney (DIS) and Fiserv (FISV) are down about 3% while AFLAC (AFL) and Globe Life (GL) are up a bit. Cerner (CERN) is up over 6% and it’s at a new high.
We’ve also had new highs from Ansys (ANSS), Becton, Dickinson (BDX), Fiserv (FISV), Globe Life (GL), Moody’s (MCO) and Trex (TREX).
-
Archives
- July 2026
- June 2026
- May 2026
- April 2026
- March 2026
- February 2026
- January 2026
- December 2025
- November 2025
- October 2025
- September 2025
- August 2025
- July 2025
- June 2025
- May 2025
- April 2025
- March 2025
- February 2025
- January 2025
- December 2024
- November 2024
- October 2024
- September 2024
- August 2024
- July 2024
- June 2024
- May 2024
- April 2024
- March 2024
- February 2024
- January 2024
- December 2023
- November 2023
- October 2023
- September 2023
- August 2023
- July 2023
- June 2023
- May 2023
- April 2023
- March 2023
- February 2023
- January 2023
- December 2022
- November 2022
- October 2022
- September 2022
- August 2022
- July 2022
- June 2022
- May 2022
- April 2022
- March 2022
- February 2022
- January 2022
- December 2021
- November 2021
- October 2021
- September 2021
- August 2021
- July 2021
- June 2021
- May 2021
- April 2021
- March 2021
- February 2021
- January 2021
- December 2020
- November 2020
- October 2020
- September 2020
- August 2020
- July 2020
- June 2020
- May 2020
- April 2020
- March 2020
- February 2020
- January 2020
- December 2019
- November 2019
- October 2019
- September 2019
- August 2019
- July 2019
- June 2019
- May 2019
- April 2019
- March 2019
- February 2019
- January 2019
- December 2018
- November 2018
- October 2018
- September 2018
- August 2018
- July 2018
- June 2018
- May 2018
- April 2018
- March 2018
- February 2018
- January 2018
- December 2017
- November 2017
- October 2017
- September 2017
- August 2017
- July 2017
- June 2017
- May 2017
- April 2017
- March 2017
- February 2017
- January 2017
- December 2016
- November 2016
- October 2016
- September 2016
- August 2016
- July 2016
- June 2016
- May 2016
- April 2016
- March 2016
- February 2016
- January 2016
- December 2015
- November 2015
- October 2015
- September 2015
- August 2015
- July 2015
- June 2015
- May 2015
- April 2015
- March 2015
- February 2015
- January 2015
- December 2014
- November 2014
- October 2014
- September 2014
- August 2014
- July 2014
- June 2014
- May 2014
- April 2014
- March 2014
- February 2014
- January 2014
- December 2013
- November 2013
- October 2013
- September 2013
- August 2013
- July 2013
- June 2013
- May 2013
- April 2013
- March 2013
- February 2013
- January 2013
- December 2012
- November 2012
- October 2012
- September 2012
- August 2012
- July 2012
- June 2012
- May 2012
- April 2012
- March 2012
- February 2012
- January 2012
- December 2011
- November 2011
- October 2011
- September 2011
- August 2011
- July 2011
- June 2011
- May 2011
- April 2011
- March 2011
- February 2011
- January 2011
- December 2010
- November 2010
- October 2010
- September 2010
- August 2010
- July 2010
- June 2010
- May 2010
- April 2010
- March 2010
- February 2010
- January 2010
- December 2009
- November 2009
- October 2009
- September 2009
- August 2009
- July 2009
- June 2009
- May 2009
- April 2009
- March 2009
- February 2009
- January 2009
- December 2008
- November 2008
- October 2008
- September 2008
- August 2008
- July 2008
- June 2008
- May 2008
- April 2008
- March 2008
- February 2008
- January 2008
- December 2007
- November 2007
- October 2007
- September 2007
- August 2007
- July 2007
- June 2007
- May 2007
- April 2007
- March 2007
- February 2007
- January 2007
- December 2006
- November 2006
- October 2006
- September 2006
- August 2006
- July 2006
- June 2006
- May 2006
- April 2006
- March 2006
- February 2006
- January 2006
- December 2005
- November 2005
- October 2005
- September 2005
- August 2005
- July 2005
 Eddy Elfenbein is a Washington, DC-based speaker, portfolio manager and editor of the blog Crossing Wall Street. His