Author Archive
-
CWS Market Review – May 2, 2014
Eddy Elfenbein, May 2nd, 2014 at 8:10 am“How poor are they that have not patience!” – Othello Act II, Scene 2
What a busy week for us! First-quarter earnings reports are still coming in, the Federal Reserve announced another taper, plus we had several important economic reports like Q1 GDP and ISM. On top of that, news broke that AT&T is considering buying our favorite satellite-TV stock, DirecTV. I don’t know if any deal will come about, but shares of DTV jumped more than 4% yesterday to reach a new all-time high. I’ll have more on that in a bit.
Overall, earnings season is going well. Of course, going into earnings season, a lot of companies skillfully lowered expectations just enough to exceed them. So far, 352 of the 500 companies in the S&P 500 have reported results. Of those, 75% have beaten earnings expectations, while 52% have beaten sales expectations.
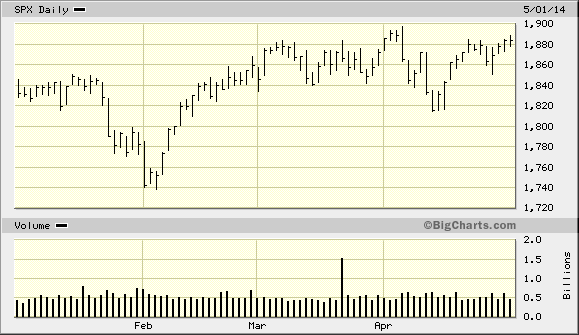
Before Thursday’s minor 0.01% drop in the S&P 500, the index rallied 10 times in 12 days. In fact, during the day on Thursday, the S&P 500 reached its highest level since April 4, which was the day the index hit its all-time intra-day high. At one point, we were less than 0.5% from reaching a new all-time high. On Wednesday, the Dow Jones 30 did close at an all-time high (thanks to $100+ stocks like Merck, Exxon, 3M and our own McDonald’s).
In this week’s CWS Market Review, I’ll break down the latest goings-on for you. I’ll also preview next week’s Buy List earnings reports from DirecTV and Cognizant Technology. But first, let’s look at some recent economic news.
Q1 Was Bad, but Q2 Should Be Better
By now, the evidence is clear that the economy was lousy in Q1 thanks to the bitter winter weather. On Wednesday, the Commerce Department reported that real GDP rose by a grand total of 0.1% for the first three months of 2014. That’s pretty bad. The economy needs to grow, in real terms, around 2.5% just to absorb new folks entering the workforce. One of the positives in the report was that personal-consumption expenditures rose by 3%. Also, the big drag caused by austerity at the state and local level seems to have ended.
We won’t know until the summer how well the economy did during Q2, but I suspect we’ll see some improvements. Some evidence for my optimism came on Thursday, when we learned that the ISM Manufacturing Index rose for the third-straight month. For April, the index climbed to 54.9. Any reading above 50 means that the manufacturing sector of the economy is expanding. The ISM dropped sharply in January, and we’ve made back most of what we lost.
I’m writing this report early on Friday, ahead of the big April jobs report, which I think could be a big one (be sure to check the blog for updates). Economists expect an increase of 215,000 jobs. Earlier this week, ADP, the payroll firm, said that 220,000 private-sector jobs were created last month. I should warn you that the ADP report doesn’t have a great track record of predicting the government’s numbers. The recent initial jobless claims reports have been encouraging, although this past week’s report dropped off some. Slowly but surely, the economy and jobs market are getting better.
It’s not just me saying that, but it’s the Federal Reserve as well. Here’s the opening sentence of the Fed’s latest policy statement: “Information received since the Federal Open Market Committee met in March indicates that growth in economic activity has picked up recently, after having slowed sharply during the winter, in part because of adverse weather conditions.” (Remember how the bears laughed at the weather excuse?)
The Fed announced it will again taper its bond purchases. Starting in May, the Fed will buy $25 billion worth of Treasuries and $20 billion worth of mortgage-backed securities. Janet and her pals on the FOMC said, “The Committee will likely reduce the pace of asset purchases in further measured steps at future meetings.” At this rate, the Fed should be completely done with its Quantitative Easing by the end of the year. Interestingly, this week’s policy statement got a unanimous vote.
On Thursday, the Commerce Department reported that consumer spending rose by 0.9% in March. That’s the biggest increase in nearly five years. Those numbers probably reflect the pent-up demand created by the frigid weather. Economists were expecting an increase of 0.6%. The evidence continues to suggest a slow- to moderate-paced recovery.
Keeping in mind the issues surrounding Q1, let’s take a look at our recent earnings reports.
Ford Misses by Seven Cents per Share
I confidently predicted that Ford Motor (F) would easily beat its earnings estimates. Boy, was I wrong. The winter hit them harder than I expected. Last Friday, Ford said that it earned 24 cents per share for Q1, which was seven cents below Wall Street’s estimates.
On the plus side, revenues came in at $35.9 billion, which was $1.7 billion more than expectations. Ford’s core business is truck sales in North America, and that was fairly sluggish, but Ford is seeing better numbers overseas. Sales in Europe were up 11%, and sales in China jumped 45%.
I was pleased to hear the automaker stick by its full-year profit forecast of $7 billion to $8 billion. On Thursday, Ford said that sales in April fell by 1%, but their truck sales were up by 7%. The company also made official what everyone expected: COO Mark Fields will take over as CEO in July when Alan Mulally departs. We should give credit to Mulally. He did a great job at Ford. I’m keeping my Buy Below on Ford at $18 per share.
Moog Is a Buy up to $69 per Share
Moog (MOG-A) was our problem child last earnings season, so I was pleased to see better news this time. Last Friday, Moog reported earnings of 82 cents per share, which matched expectations. In January, the maker of flight-control systems beat earnings by a penny per share but lowered their full-year guidance to $3.65 per share (their fiscal year ends in September). The previous range was $3.95 to $4.10 per share.
The good news is that Moog still stands by its $3.65 target for this fiscal year. The CEO said, “This was a good-news quarter, with earnings coming in ahead of plan and healthy cash flow.” I like these results. I’m raising my Buy Below on Moog to $69 per share.
Four Buy List Earnings: AFL, EBAY, ESRX and FISV
On Tuesday, we had four Buy List earnings reports. Here are summaries of each one.
With AFLAC (AFL), it’s the same story that by now we know well. The supplemental-insurance company is doing very well businesswise, but the weak yen continues to gobble up their profits. For Q1, AFLAC had operating earnings of $1.69 per share, and that’s after the unfavorable exchange rate knocked off ten cents per share (which isn’t as bad as the results from some recent quarters). Excluding currency problems, operating earnings were up 5.9% from a year ago.
What I really wanted to see was AFLAC’s guidance. For Q2, AFLAC sees earnings ranging between $1.54 and $1.68 per share. That’s pretty good. Wall Street had been expecting $1.58. The downside is that AFLAC lowered their full-year guidance. The original range was $6.31 to $6.49 per share. Now it’s $6.06 to $6.40 per share. Those estimates are based on a yen/dollar exchange rate between 100 and 105. The stock got a nice boost when the earnings report came out. I’m keeping our Buy Below at $68 per share. AFLAC is going for about 10 times this year’s estimate. Keep in mind Iago’s words from this week’s epigraph.
Shares of eBay (EBAY) got hit hard this week, even though the online marketplace beat estimates. In last week’s CWS Market Review, I said that Wall Street’s consensus of 67 cents per share was almost certainly too low, and I was right. eBay reported Q1 adjusted earnings of 70 cents per share, which topped the Street by three cents per share. Officially, eBay lost $2.3 billion last quarter, going by net earnings, but that’s because they took a massive tax charge in order to repatriate $9 billion in foreign earnings. A lot of tech companies have been warehousing mountains of cash overseas because they don’t want to generate a fat tax bill, so it was a bit of a shock that eBay went through with it. Maybe others will follow.
For Q2, eBay sees earnings of 67 to 69 cents per share, which was a tad below the Street’s consensus of 70 cents per share. Importantly, eBay reiterated their full-year guidance of $2.95 to $3.00 per share. Wall Street’s consensus was at $2.99 per share. Sales for Q1 rose 14% to $4.26 billion. These numbers are pretty much what I expected, but I think traders wanted something to get excited about. Who knows, but the stock dropped 5% on Wednesday, and I really can’t see why. I’m lowering my Buy Below on eBay to $58 to reflect the downturn, but I think the stock continues to be a very good buy.
I found the earnings report at Express Scripts (ESRX) more troubling than the one at eBay. The pharmacy-benefit manager reported Q1 earnings of 99 cents per share, which was two cents below expectations. Express Scripts also lowered their full-year guidance by six cents per share at each end. The new range is $4.82 to $4.94 per share, but that still adds up to year-over-year growth of 17% to 20%. The company said it will lay off 1,890 workers nationwide. As if that weren’t enough, the company also said that it received subpoenas related to its relationships with drug makers. Traders did not like the bad news. ESRX got dinged for a 6.2% loss on Tuesday. I’m lowering my Buy Below to $71 per share.
Fiserv (FISV) may be the big star of this earnings season. For Q1, they made 82 cents per share, which easily beat Wall Street’s estimates of 74 cents per share. Earnings were up 22% from a year ago, while quarterly revenue rose 7.1% to $1.23 billion (which also beat expectations). Fiserv reaffirmed full-year guidance of $3.28 to $3.37 per share, which represents growth of 10% to 13%. The stock jumped after the earnings news and continued to rally to a new 52-week high. I like this stock a lot. I’m raising our Buy Below on Fiserv to $64 per share.
Earnings Next Week from DirecTV and Cognizant
We have two Buy List earnings reports for next week. On Tuesday, May 6, DirecTV will report Q1 earnings. Then on Wednesday, May 7, Cognizant Technology Solutions is due to report.
Three months ago, DirecTV (DTV) smashed Wall Street’s earnings forecast by 23 cents per share. The satellite-TV firm has been doing a great business lately, especially in Latin America. I also like that DirecTV uses its share buybacks to reduce share count. Too many companies merely buy back the same amount they’ve issued to senior execs.
But the big news for DirecTV came on Thursday, when the Wall Street Journal reported that AT&T has been talking to them about a possible acquisition. This makes sense as a response to the Comcast/Time Warner Cable deal. DirecTV has a market cap of $41 billion. There aren’t many companies big enough to buy them, but AT&T is one. I can’t predict if a deal will happen, but I’ll note that it makes a lot of sense.
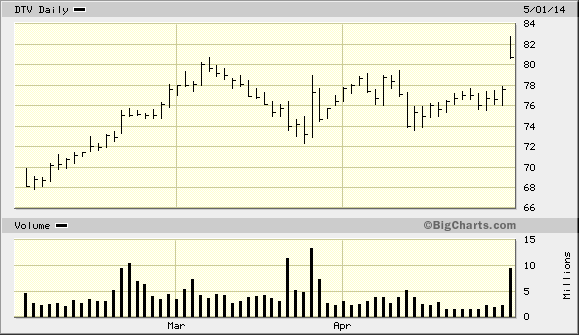
On Thursday, shares of DTV jumped more than 4% to close at $80.76 per share. Analysts currently expect earnings of $1.50 per share for Q1. For now, I’m keeping my Buy Below price at $84 per share.
Shares of Cognizant Technology Solutions (CTSH) have been pretty quiet lately, but I think that could change soon. Three months ago, Cognizant told us to expect Q1 earnings of 59 cents per share on revenue of $2.42 billion. Bear in mind that Cognizant earned 47 cents per share for last year’s Q1, so we’re talking about pretty strong growth.
For all of 2014, Cognizant sees earnings of at least $2.51 per share and revenues of at least $10.3 billion. To add some context, CTSH earned $2.02 per share last year and $1.72 per share in 2012. Cognizant remains a good buy up to $52 per share.
That’s all for now. More earnings reports are coming our way next week. We’ll also get reports on trade, consumer credit and productivity. Be sure to keep checking the blog for daily updates. I’ll have more market analysis for you in the next issue of CWS Market Review!
– Eddy
-
Morning News: May 2, 2014
Eddy Elfenbein, May 2nd, 2014 at 7:08 amEuro-Area Manufacturing Growth Accelerates From Germany to Italy
RBS Soars After Reporting Increase in First-Quarter Profit
Yellen Fed Resigns Itself to Diminished Expectations for Growth
Jobless Claims Rise, But Labor Market Is Seen Strengthening
NYSE Settles Charges That Its Investor Safeguards Fell Short
GM Defies Recall Taint as U.S. Rebound Spurs Truck Demand
Fields Ready to Hit Ground Running as Ford’s Chief
AstraZeneca Rejects Pfizer’s Raised Bid of $106 Billion
Kraft Profit Rises as Margins Improve
5-Step Plan For New Target CIO
LinkedIn Revenue Forecast Trails Estimates as Growth Slows
Exxon Profit Declines Less Than Expected as Expenses Tumble
BASF Q1 Operating Profit Edges Lower on Currency Effects
Joshua Brown: NYSE Margin Debt Falls
Cullen Roche: Why the Endogenous Money Debate Matters
Be sure to follow me on Twitter.
-
April ISM Rises to 54.9
Eddy Elfenbein, May 1st, 2014 at 12:12 pmToday’s ISM report showed its third-straight monthly increase. The index took a big drop in January due to the weather, but we’ve made back most of what we’ve lost.
-
Possbile Merger Name: Direct A TV & T
Eddy Elfenbein, May 1st, 2014 at 9:52 amWelcome to May! The year is one-third over, and the S&P 500 is up 2.56% for the year (including dividends).
There’s an old Wall Street saying, “Sell in May and go away.” Well, there’s some truth to that in a large historical sense, but there’s no value in literally following that advice. Historically, the Dow has hit a near-term peak on May 6, then rallied during the summer before a fall sell-off. From May 6 to October 29, the Dow has historically gained just 0.35%, meaning it’s been about flat for half the year. Nearly the entire yearly capital gain comes from October 29 to May 6.
In economic news, jobless claims unexpectedly rose last week. The number climbed to 344,000 for the week ending April 28. That’s a bit of surprise since the recent numbers have been so strong. We’ll learn a lot more about the jobs market tomorrow when the government releases the April jobs report. Yesterday’s ADP report said that 220,000 private sector jobs were created last month, but the ADP isn’t a very reliable indicator. Also, the Commerce Department reported that consumer spending surged by 0.9% in March, that’s the biggest increase in five years.
Ford ($F) reported this morning that sales fell 0.7% in April which was below estimates. This is also a big day for Ford as the company has named COO Mark Fields to replace Alan Mulally as CEO. They’ve been making it clear that Fields is their choice for months. He’ll take over on July 1.
But the biggest news for our Buy List today is that the Wall Street Journal reported that AT&T spoke to DirecTV ($DTV) about a possible takeover. This would make sense as a response to the Comcast/Time Warner Cable deal. I don’t know how serious the companies are, but traders are taking the news seriously. The shares are currently up 5.7% this morning.
-
Morning News: May 1, 2014
Eddy Elfenbein, May 1st, 2014 at 6:48 amU.K. Manufacturing Grows More Than Forecast on Exports
Fed Says Economy Improving a LIttle
U.S. Plays Delusional Economic Numbers Game
U.S. Lost $11.2 Billion in GM Bailout, Latest TARP Report Says
Criminal Charges Against Banks Risk Sparking Crisis
EBay’s Sales Forecast Falls Short of Highest Estimates
Sony Slashes Profit Forecast Again, Raising Pressure on CEO
Lloyds Banking Group Plans to Float TSB in June
”The Lego Movie,” HBO Shows Boost Time Warner Results
Yelp Is Headed Towards Another Year Without A Profit
How GE’s Alstom Talks Almost Killed $17 Billion Deal
Roger Nusbaum: No, Your Portfolio Should Not Have 20% in Gold and 30% in Cash
Joshua Brown: Why Don’t Wall Street Stars Get Endorsement Deals?
Be sure to follow me on Twitter.
-
Looking at Gross Output
Eddy Elfenbein, April 30th, 2014 at 3:44 pmFrom Gary Alexander at Navellier Market Mail:
To the Rescue – a New (and Better?) Way to Measure the U.S. Economy
Last Friday, the Bureau of Economic Analysis (BEA) introduced a new number, one that I have been waiting to see for a long time. I’ve known about this new and better method of measuring the economy since 1990, when Dr. Mark Skousen developed the rationale for a new way of looking at the economy in his book, “The Structure of Production.” At the time, I was editing Skousen’s newsletter, where he also examined the investment implications of his theory, which focuses on the earlier stages of production.
In short, the Gross Domestic Product (GDP) statistic only covers final sales – end sales –the cost of the finished goods bought by consumers, government and businesses. In the fourth quarter of 2013, our $17 trillion economy (i.e., GDP) was composed of 68% consumer spending, 18% government spending, 16% in business investments and -2% for our trade deficit. We keep hearing that the consumer controls over two-thirds of GDP, which is true, but that’s only because GDP ignores the earlier stages of production.
It doesn’t make sense to ignore business-to-business transactions in the GDP. Businesses spend more than consumers do, but businesses (16% of GDP) are dwarfed by consumers (68%) in the GDP’s accounting.
Here’s why that doesn’t make sense. Only about 12% of private-sector jobs are in retailing, and those are some of the lowest paying jobs in America. Most people work for companies that sell to other businesses.
And if “the consumer controls the economy,” why does the widely-followed Index of Leading Economic Indicators fail to include retail sales or any other form of consumer spending? As you can see from the following list, the 10 Leading Indicators are nearly all business-oriented:
The 10 Leading Economic Indicators:
Weekly hours worked by manufacturing workers
Average weekly initial applications for unemployment insurance
Manufacturers’ new orders for consumer goods and materials
ISM Index of new orders
Manufacturers’ new orders for non-defense capital goods
New building permits for private housing units
The S&P 500 stock index
The leading credit index
The spread between long and short interest rates
Average consumer expectations for business conditionsThese 10 “leading indicators” clearly comprise a barometer based on business, not consumer, activity.
The first-ever release of this new quarterly measure – which uses an inelegant adjective (Gross Output) to create a great acronym (“GO”!) – says the total U.S. economy topped $30 trillion at the end of 2013, vs. $17 trillion for GDP. Consumer spending remains at $11.6 trillion (68% of GDP), but that’s only 39% of Gross Output. Government spending remains at $3.1 trillion (18% of GDP, but 10% of GO), while the portion allocated to business expands from 16% of GDP to the majority (51%) of national Gross Output.
In the roundest possible numbers, Gross Output is 50% business, 40% consumer and 10% government.
Fans of the GDP tell us that the consumer controls the economy, but Gross Output shows us, in the words of Skousen, that “consumer spending is largely the effect, not the cause, of prosperity.” Businesses create the products consumers eventually buy, and those products come from innovation, technology and capital investment. While GDP measures final output, it takes risk capital and imagination to know where that money is best spent – including mining, manufacturing and transportation, all leading to final demand.
The manufacturers and shippers and designers are vital components of the economy, creating jobs and adding value. A $300 wood table, for instance, involves several stages of production – from harvesting trees for lumber, which is used to shape the boards necessary to manufacture the table. Along the way, each business is paid cash. In the GDP, only the $300 table is counted, ignoring all other transactions.
Gross Output Tends to Grow (and Fall) Faster than GDP
The building blocks of Gross Output have been around for decades. In previous years, the BEA reported Gross Output on an annual basis, but with a long time delay. The breakthrough last Friday was the first-ever quarterly reporting of Gross Output on a timely basis. The building blocks of Gross Output came from the Russian-American Nobel Prize-winning economist Wassily Leontief, who developed the first input-output tables, which he regarded as a better measure of the economy than GDP. According to Skousen, I-O measured “intervening steps” in “a complex series of transactions…among real people.”
Gross Output is like GDP on steroids. Gross Output tends to rise or fall faster than GDP. In a downturn, business spending declines even faster than consumer spending. In 2009, for instance, nominal GDP fell by only 2% (with large business declines partially offset by large increases in government spending). In the same year, GO collapsed by over 7% and intermediate inputs fell by 10%. Wholesale trade fell 20%.
-
The Fed Tapers Again
Eddy Elfenbein, April 30th, 2014 at 2:09 pmThe Federal Reserve decided to taper by $10 billion; that’s $5 billion less in Treasuries and $5 billion less in mortgage-backed securities. Starting in May, the Fed will buy $25 billion each month of Treasuries and $20 billion of MBS.
Information received since the Federal Open Market Committee met in March indicates that growth in economic activity has picked up recently, after having slowed sharply during the winter in part because of adverse weather conditions. Labor market indicators were mixed but on balance showed further improvement. The unemployment rate, however, remains elevated. Household spending appears to be rising more quickly. Business fixed investment edged down, while the recovery in the housing sector remained slow. Fiscal policy is restraining economic growth, although the extent of restraint is diminishing. Inflation has been running below the Committee’s longer-run objective, but longer-term inflation expectations have remained stable.
Consistent with its statutory mandate, the Committee seeks to foster maximum employment and price stability. The Committee expects that, with appropriate policy accommodation, economic activity will expand at a moderate pace and labor market conditions will continue to improve gradually, moving toward those the Committee judges consistent with its dual mandate. The Committee sees the risks to the outlook for the economy and the labor market as nearly balanced. The Committee recognizes that inflation persistently below its 2 percent objective could pose risks to economic performance, and it is monitoring inflation developments carefully for evidence that inflation will move back toward its objective over the medium term.
The Committee currently judges that there is sufficient underlying strength in the broader economy to support ongoing improvement in labor market conditions. In light of the cumulative progress toward maximum employment and the improvement in the outlook for labor market conditions since the inception of the current asset purchase program, the Committee decided to make a further measured reduction in the pace of its asset purchases. Beginning in May, the Committee will add to its holdings of agency mortgage-backed securities at a pace of $20 billion per month rather than $25 billion per month, and will add to its holdings of longer-term Treasury securities at a pace of $25 billion per month rather than $30 billion per month. The Committee is maintaining its existing policy of reinvesting principal payments from its holdings of agency debt and agency mortgage-backed securities in agency mortgage-backed securities and of rolling over maturing Treasury securities at auction. The Committee’s sizable and still-increasing holdings of longer-term securities should maintain downward pressure on longer-term interest rates, support mortgage markets, and help to make broader financial conditions more accommodative, which in turn should promote a stronger economic recovery and help to ensure that inflation, over time, is at the rate most consistent with the Committee’s dual mandate.
The Committee will closely monitor incoming information on economic and financial developments in coming months and will continue its purchases of Treasury and agency mortgage-backed securities, and employ its other policy tools as appropriate, until the outlook for the labor market has improved substantially in a context of price stability. If incoming information broadly supports the Committee’s expectation of ongoing improvement in labor market conditions and inflation moving back toward its longer-run objective, the Committee will likely reduce the pace of asset purchases in further measured steps at future meetings. However, asset purchases are not on a preset course, and the Committee’s decisions about their pace will remain contingent on the Committee’s outlook for the labor market and inflation as well as its assessment of the likely efficacy and costs of such purchases.
To support continued progress toward maximum employment and price stability, the Committee today reaffirmed its view that a highly accommodative stance of monetary policy remains appropriate. In determining how long to maintain the current 0 to 1/4 percent target range for the federal funds rate, the Committee will assess progress–both realized and expected–toward its objectives of maximum employment and 2 percent inflation. This assessment will take into account a wide range of information, including measures of labor market conditions, indicators of inflation pressures and inflation expectations, and readings on financial developments. The Committee continues to anticipate, based on its assessment of these factors, that it likely will be appropriate to maintain the current target range for the federal funds rate for a considerable time after the asset purchase program ends, especially if projected inflation continues to run below the Committee’s 2 percent longer-run goal, and provided that longer-term inflation expectations remain well anchored.
When the Committee decides to begin to remove policy accommodation, it will take a balanced approach consistent with its longer-run goals of maximum employment and inflation of 2 percent. The Committee currently anticipates that, even after employment and inflation are near mandate-consistent levels, economic conditions may, for some time, warrant keeping the target federal funds rate below levels the Committee views as normal in the longer run.
Voting for the FOMC monetary policy action were: Janet L. Yellen, Chair; William C. Dudley, Vice Chairman; Richard W. Fisher; Narayana Kocherlakota; Sandra Pianalto; Charles I. Plosser; Jerome H. Powell; Jeremy C. Stein; and Daniel K. Tarullo.
-
Dept. of Misleading Stats
Eddy Elfenbein, April 30th, 2014 at 10:04 amOne of my pet peeves is misleading statistics. It’s one thing when facts are simply wrong, but it’s another when the numbers are accurate but they’re presented in such a way as to tell a different story.
This morning, Brett Arends, one of my favorite columnists at the WSJ tweeted this out:
Over 90% of the returns from US stocks since 1927 are an illusion caused by inflation pic.twitter.com/jOIUfu8mL6
— Brett Arends (@BrettArends) April 30, 2014
Is that right that inflation has eaten up 90% of stock gains? Yes, but no. The chart is accurate, or at least it looks similar to my data. The problem is the 90%. The reason why is that it uses a linear measure against compound growth. I’m throwing out my red flag. When you mix those two measures, the 90% figure is meaningless. All it really tells us is that inflation averaged about 2.8% per year (growth of 2.78% for 84 years equals tenfold).
Put it this way: If you have any data series with positive inflation, after a long enough period, inflation will reach “90%.” The nominal figure will by definition grow faster, and those gains will compound themselves.
If the stock market returned 10% per year in nominal terms and real returns averaged 9.9%, after 2,300 years, by the methodology described, inflation will have taken 90% of the gains. The numbers are correct, but interpretation is misleading.
Here’s another example of misleading stats. Please bear in mind that I’m not saying the numbers are incorrect, just how we read them.
You’ll often hear that from the March 2000 peak to the March 2009 low, the stock market lost 46% (the Wilshire 5000). That’s correct. But if you take a starting point 18 months before the peak, and an ending point one year after the low, then the market made 78%. It’s true that I’m being selective with my data, but what’s so special about measuring from the peak to trough?
-
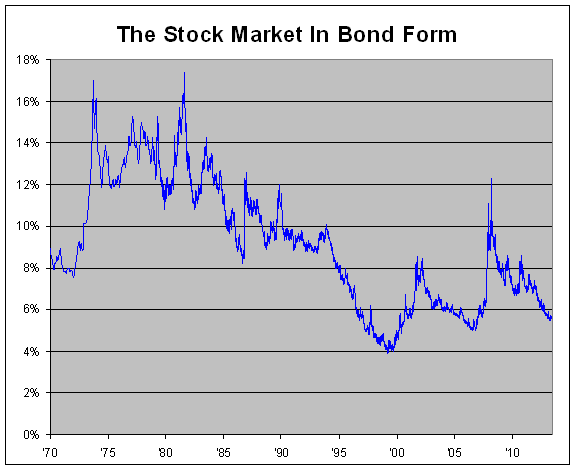
What if the Stock Market Were a Bond?
Eddy Elfenbein, April 30th, 2014 at 9:39 amHere’s an update to one of my more off-the-wall ideas. I was curious to see what the historical performance of the stock market looks like, but in the form of a bond.
Crazy? Let me explain.
I took all of the historical market performance of the Wilshire 5000 (including dividends) and invented a hypothetical long-term bond that matched the market’s daily gains step-for-step.
I assumed that it’s a bond of infinite maturity and pays a fixed coupon.
There’s one hitch, though. I have to choose a starting yield-to-maturity for the beginning of the data series in December 1970. So this isn’t a completely kosher experiment because the starting point is based on my guess.
If I choose a number that’s too high, the historical performance won’t be able to keep up, and the yield-to-maturity would grow higher and higher and soon leave orbit. Conversely, if my starting YTM is too low, the yield would gradually get pushed down to microscopic levels.
Fortunately, the data makes my job easy. After four decades, the window I have to work with is pretty narrow. Starting with 10% is too high, and 8% is too low. After playing with the numbers, I finally settled on 8.93%.
Even though this “bond” is completely make-believe, it reflects what the actual stock market really did for the past 43 years. Through yesterday, the “bond’s” yield stood at 5.63%.
Here’s what the actual stock market looks like, expressed in the form of a bond:
-
Q1 GDP Growth = 0.1%
Eddy Elfenbein, April 30th, 2014 at 9:27 amThe government reported that the economy grew by a measly 0.1% in the first quarter of this year. That’s a terrible number. Obviously, the weather was an issue, but even so, 0.1% is very bad.
This was the worst quarter for the economy since the first quarter of 2011. We barely came in below the growth rate of the fourth quarter of 2012. Over the last seven years, the economy has grown by 8.3% in real terms. In the last 32 quarters, economic growth has topped 3.2% only five times. The U.S. economy grew less over the last 14 years than it did in the seven years prior to that.
-
Archives
- June 2026
- May 2026
- April 2026
- March 2026
- February 2026
- January 2026
- December 2025
- November 2025
- October 2025
- September 2025
- August 2025
- July 2025
- June 2025
- May 2025
- April 2025
- March 2025
- February 2025
- January 2025
- December 2024
- November 2024
- October 2024
- September 2024
- August 2024
- July 2024
- June 2024
- May 2024
- April 2024
- March 2024
- February 2024
- January 2024
- December 2023
- November 2023
- October 2023
- September 2023
- August 2023
- July 2023
- June 2023
- May 2023
- April 2023
- March 2023
- February 2023
- January 2023
- December 2022
- November 2022
- October 2022
- September 2022
- August 2022
- July 2022
- June 2022
- May 2022
- April 2022
- March 2022
- February 2022
- January 2022
- December 2021
- November 2021
- October 2021
- September 2021
- August 2021
- July 2021
- June 2021
- May 2021
- April 2021
- March 2021
- February 2021
- January 2021
- December 2020
- November 2020
- October 2020
- September 2020
- August 2020
- July 2020
- June 2020
- May 2020
- April 2020
- March 2020
- February 2020
- January 2020
- December 2019
- November 2019
- October 2019
- September 2019
- August 2019
- July 2019
- June 2019
- May 2019
- April 2019
- March 2019
- February 2019
- January 2019
- December 2018
- November 2018
- October 2018
- September 2018
- August 2018
- July 2018
- June 2018
- May 2018
- April 2018
- March 2018
- February 2018
- January 2018
- December 2017
- November 2017
- October 2017
- September 2017
- August 2017
- July 2017
- June 2017
- May 2017
- April 2017
- March 2017
- February 2017
- January 2017
- December 2016
- November 2016
- October 2016
- September 2016
- August 2016
- July 2016
- June 2016
- May 2016
- April 2016
- March 2016
- February 2016
- January 2016
- December 2015
- November 2015
- October 2015
- September 2015
- August 2015
- July 2015
- June 2015
- May 2015
- April 2015
- March 2015
- February 2015
- January 2015
- December 2014
- November 2014
- October 2014
- September 2014
- August 2014
- July 2014
- June 2014
- May 2014
- April 2014
- March 2014
- February 2014
- January 2014
- December 2013
- November 2013
- October 2013
- September 2013
- August 2013
- July 2013
- June 2013
- May 2013
- April 2013
- March 2013
- February 2013
- January 2013
- December 2012
- November 2012
- October 2012
- September 2012
- August 2012
- July 2012
- June 2012
- May 2012
- April 2012
- March 2012
- February 2012
- January 2012
- December 2011
- November 2011
- October 2011
- September 2011
- August 2011
- July 2011
- June 2011
- May 2011
- April 2011
- March 2011
- February 2011
- January 2011
- December 2010
- November 2010
- October 2010
- September 2010
- August 2010
- July 2010
- June 2010
- May 2010
- April 2010
- March 2010
- February 2010
- January 2010
- December 2009
- November 2009
- October 2009
- September 2009
- August 2009
- July 2009
- June 2009
- May 2009
- April 2009
- March 2009
- February 2009
- January 2009
- December 2008
- November 2008
- October 2008
- September 2008
- August 2008
- July 2008
- June 2008
- May 2008
- April 2008
- March 2008
- February 2008
- January 2008
- December 2007
- November 2007
- October 2007
- September 2007
- August 2007
- July 2007
- June 2007
- May 2007
- April 2007
- March 2007
- February 2007
- January 2007
- December 2006
- November 2006
- October 2006
- September 2006
- August 2006
- July 2006
- June 2006
- May 2006
- April 2006
- March 2006
- February 2006
- January 2006
- December 2005
- November 2005
- October 2005
- September 2005
- August 2005
- July 2005
 Eddy Elfenbein is a Washington, DC-based speaker, portfolio manager and editor of the blog Crossing Wall Street. His