-
Looking at the May Swoon
Posted by Eddy Elfenbein on June 1st, 2010 at 10:26 amThe stock market just finished its worst May since 1940. As it turns out, watching France fall to the Nazis isn’t good for stocks here. Also, watching the euro fall to reality is pretty nasty as well.
Let’s take a closer look at where the market stands today. Here’s the S&P 500 (black line, left scale) along with its earnings (gold line, right scale).
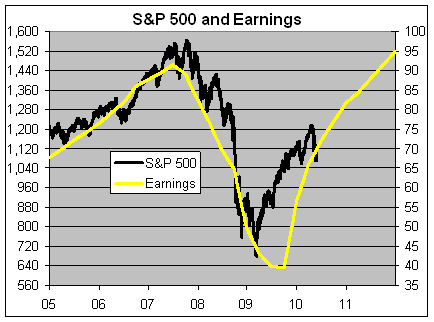
I’ve scaled the two lines at a ratio of 16 to 1 so whenever the lines cross, the market’s P/E Ratio is exactly 16.
Let me add that looking at the market’s P/E Ratio is far from perfect (the future earnings line is, of course, merely forecast), but nevertheless we can gain some insights as to what investors are thinking at the moment.
Two items stand out. The first is that the S&P 500 has fallen below a P/E Ratio of 16 which has generally been its lower bound over the past few years. The second is that the earnings forecast is still very favorable. If stocks keep pace with valuations, then the S&P 500 could easily be over 1400 within 18 months.
This is where the problems come in. It appears that investors are beginning to question the robustness of the recovery. Given the amount of aid needed, that’s certainly understandable. So if the earnings forecast turns out to be overly optimistic, then the whole bullish scenario falls apart.
My feeling is that the bearish cause has been pushed a bit too. Consider that many companies are still maintaining decent guidance. Even the bad guidance isn’t that bad. On Friday, shares of J.C. Penney (JCP) got knocked due to “poor guidance.” I’d agree that JCP is a weak buy right now, but they merely said to expect full-year EPS of $1.64 which was one penny below the Street.
I used JCP as one example, but if the future yellow line is off, then we’re going to have to see much more lower guidance announcements. That simply hasn’t come yet.
This week, we’ll get some news on our Buy List stock, Jos. A Bank Clothiers (JOSB). This company hasn’t missed an earnings forecast in four years. They haven’t given guidance for this year but they have said that they plan to open 30 to 40 new stores. Wall Street expects 71 cents per share which is a nice increase over the 62 cents per share from a year ago. My numbers say it will be close to 75 cents a share.
JOSB is a solid buy. We’ll know more on Thursday (correction: Tuesday) when the earnings report comes out. -
Happy Memorial Day
Posted by Eddy Elfenbein on May 31st, 2010 at 12:46 pm
-
Monsanto -7%
Posted by Eddy Elfenbein on May 27th, 2010 at 1:19 pmMonsanto (MON) is down 7% today on the news of sharply lower guidance. A reader writes:
I wrote you a few weeks ago about MONSANTO. And you were talking about lowered guidance, and how it’s like “cockroaches”, they keep coming out. Well, you were right. Thanks for the tip. I decided to sell shortly afterwards — it was difficult because I felt that I had spent so much time understanding their business and the prospects, but you were right, the stock has no idea I own it.
The point is that companies aren’t like sports teams that can suddenly rally. If there’s one problem you see, there are usually several more you don’t see (like cockroaches).
Just because a stock is down from its highs doesn’t mean it’s cheap. Monsanto missed its last two earnings reports and that was a tip-off to today’s news. -
The Calendar Says Buy
Posted by Eddy Elfenbein on May 27th, 2010 at 11:50 amA few years ago, for reasons unclear, I decided to look at the entire history of the Dow Jones to see how it performed during a typical year. Once I emerged from my dark laboratory, I was able to compile this chart.
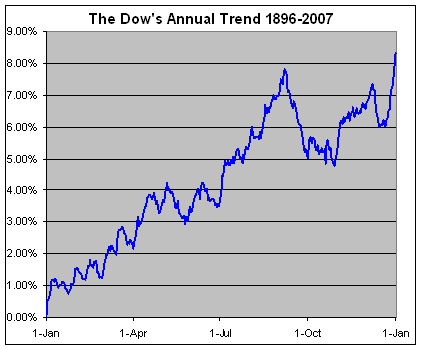
We’ve just entered one of the best times for the market. From May 25 to June 12, the Dow has gained an average of 1.27%. From May 25 to September 6, the Dow has gained an average of 4.72%. That’s more than half of the Dow’s entire historic capital gain coming in a little over three months.
On top of that, all of the market’s gains have come on the last four trading days of the month plus the first three of the following month. Outside that, the market is down. -
Q1 GDP Growth Revised Lower
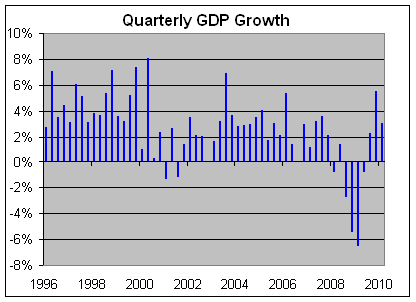
Posted by Eddy Elfenbein on May 27th, 2010 at 10:45 amThe government pared back its estimate of first-quarter GDP growth. The original report said the economy grew by 3.2% for the firth three months of the year but now the Feds say it was 3.0%. That’s not a big change but it highlights the issue that the economy isn’t growing nearly fast enough to pull us from the recession.
Compare the last bar on this chart to the long stretch of GDP growth in the late 1990s.
As an investor, this caught my eye:The latest report showed consumers increased their spending by 3.5%. That was below the previously estimated 3.6% gain but more than double the 1.6% increase of the fourth quarter.
That’s a good sign. Sure enough, this comes out today: Tiffany raises outlook as profit, sales soar. As always, company guidance is key. If you’re a publicly traded company, you don’t want to shout out good news unless you can back it up. If Tiffany (TIF) is doing well, that means the high-end market is recovering.
Excluding one time items, Tiffany earned 48 cents per share, beating Wall Street forecast of 37 cents, according to Thomson Reuters I/B/E/S.
Sales at its stores open at least a year, or same-store sales rose 10 percent, lifted by growing international sales.
In Asia, sales rose 50 percent, while at its flagship store on Manhattan’s Fifth Avenue, sales were up 26 percent.
Overall sales rose 22 percent to $633.6 million during the quarter.
Tiffany raised its full year profit forecast to a range of $2.55 to $2.60 per share, above the average Wall Street estimate of $2.51. Tiffany expects sales to be up 11 percent this year and to open 16 stores.So they beat estimates by nearly 30% and raised their full-year. I’m not suggesting TIF is a buy, the stock is a bit pricey, but it gives us a clue where business is strong.
The advantage of looking at Tiffany is that its fiscal cycle is slightly off most other companies. Their fiscal calendar ends at the end of January instead of the beginning. This makes sense because they want any lingering Christmas sales in the same reporting period. As a result, today’s report covers February, March and April — whereas the last earnings season for most stocks was for January, February and March. This off-cycle report could mean that consumers are in a better mood than Wall Street thinks. -
100 Years Ago — King Edward’s Funeral
Posted by Eddy Elfenbein on May 26th, 2010 at 11:12 pmThis week marks the 100th anniversary of the funeral of King Edward VII. This was an interesting event in world history since it was the last great gathering of European monarchs.
Just about every king or crown prince was invited (see a listing here). In fact, many of them were related to the late king. The soon-to-hated Kaiser was Edward’s nephew. You’d hardly know that in just a few years the whole world these people knew was to be blown apart by the Great War.
King Edward’s funeral is also used as an entry point in George Dangerfield’s book “The Strange Death of Liberal England.” For a student of history, the ceremony serves as a good dividing line between two periods. Two worlds, really. If you want to read really good writing, check out pages 18 and 19 here.
The Library of Congress has some footage of the funeral which I’ve embedded below. Everyone is marching by rank so in the very back of the line is a commoner—the representative of a still-strange form of government—Former President Teddy Roosevelt. This is oddly symbolic because even though the U.S. was at the back of the line, it was about to become the world’s most powerful nation.
I’ve watched this a few times. I can’t be sure but I think TR appears at 4:53 in the lower right part of the screen. Here’s the NYT‘s coverage and it confirms that TR is carrying his overcoat. -
John Wren’s $41 Million ‘Golden Coffin’
Posted by Eddy Elfenbein on May 26th, 2010 at 1:02 pmThis is one of the most outrageous executive perks I’ve ever heard of. The heirs of John Wren, the CEO of Omnicom Group (OMC), will receive $41 million from the company at the time of his death.
At Omnicom Group, the chief executive gets paid until death does him part — and then even after that.
The holding company offers CEO John Wren and other top employees a perk commonly known as a “golden coffin” — a death benefit granted to heirs after the officer’s ultimate demise. Omnicom investors today rejected a proposal calling on the company to rein in this form of generosity, which could mean an additional $41 million in payouts to the 57-year-old Mr. Wren’s survivors.
The proposal’s proponent, Amalgamated Bank’s LongView investment fund, argued that it makes no sense for shareholders to make payments to the CEO in return for no services. It added that senior executives have ample time while alive to build a pension fund, buy life insurance or engage in other estate-planning activities.
“Instead of pay-for-performance, golden-coffin provisions are simply ‘pay for no pulse,'” said Scott Zdrazil, director of corporate governance at Amalgamated Bank of New York. -
FinReg’s from Mays Past
Posted by Eddy Elfenbein on May 26th, 2010 at 12:44 pmFrom Gary Alexander:
The Aldrich-Vreeland Act was passed May 30, 1908, in response to the Panic of 1907. The punitive measures included a tax of up to 10% on notes based on securities other than federal bonds. It also established a commission to investigate the currency and banking systems. President Theodore Roosevelt named Aldrich – a Rhode Island Republican and namesake for his grandson, Nelson Aldrich Rockefeller – as chairman of the National Monetary Commission. All this came about five years before the birth of the Federal Reserve and Internal Revenue Service in 1933.
The Securities Act of 1933 was signed into law on May 27, 1933. It was designed to prevent future Panics – now called Depressions. This federal legislation of securities required all new issues to be registered with the Federal Trade Commission. A year (and a week) later, the Securities and Exchange Commission (1934) was formed on June 6, 1934 to enforce the Securities Act. Before that, states oversaw securities offerings under a variety of “blue sky” Kansas enacted the first blue sky law in 1911. By 1933, 47 states (all but Nevada) enacted them
Ironically, May 27, 1933 was also the opening day of the “Century of Progress” World’s Fair in Chicago, and the opening day for Walt Disney’s early cartoon effort, “Who’s Afraid of the Big Bad Wolf?” -
Unitedhealth Group Offers Huge Dividend Increase
Posted by Eddy Elfenbein on May 26th, 2010 at 11:41 amHooray for Unitedhealth Group (UNH)! The company is jumping on my lonely call for much-increased dividends. UNH said it’s going to start paying a quarterly dividend of 12.5 cents per share instead of its measly three cents a share it paid annually.
My only question is why they didn’t they do this years ago? For the past few years, Unitedhealth has made about $3 per share, yet they only paid out about 1% of that to shareholders. What did they do with their money? You guessed it—large share buybacks. And what did shareholders get for all those buybacks? Not much at all. For over four years, the stock has been a dud.
The AP writes: “UnitedHealth is the largest publicly traded health insurer based on revenue. Stifel Nicolaus analyst Tom Carroll says it is extremely unusual for a health insurer to offer more than a token dividend.” I don’t think UNH will be the last. The projected dividend yield works out 1.7%. -
Fascinating Factoid of the Day
Posted by Eddy Elfenbein on May 26th, 2010 at 9:39 amFrom Matt Ridley’s The Rational Optimist:
Pollution from driven cars has fallen so fast it is now below that of parked cars in 1970.
-
Archives
- July 2026
- June 2026
- May 2026
- April 2026
- March 2026
- February 2026
- January 2026
- December 2025
- November 2025
- October 2025
- September 2025
- August 2025
- July 2025
- June 2025
- May 2025
- April 2025
- March 2025
- February 2025
- January 2025
- December 2024
- November 2024
- October 2024
- September 2024
- August 2024
- July 2024
- June 2024
- May 2024
- April 2024
- March 2024
- February 2024
- January 2024
- December 2023
- November 2023
- October 2023
- September 2023
- August 2023
- July 2023
- June 2023
- May 2023
- April 2023
- March 2023
- February 2023
- January 2023
- December 2022
- November 2022
- October 2022
- September 2022
- August 2022
- July 2022
- June 2022
- May 2022
- April 2022
- March 2022
- February 2022
- January 2022
- December 2021
- November 2021
- October 2021
- September 2021
- August 2021
- July 2021
- June 2021
- May 2021
- April 2021
- March 2021
- February 2021
- January 2021
- December 2020
- November 2020
- October 2020
- September 2020
- August 2020
- July 2020
- June 2020
- May 2020
- April 2020
- March 2020
- February 2020
- January 2020
- December 2019
- November 2019
- October 2019
- September 2019
- August 2019
- July 2019
- June 2019
- May 2019
- April 2019
- March 2019
- February 2019
- January 2019
- December 2018
- November 2018
- October 2018
- September 2018
- August 2018
- July 2018
- June 2018
- May 2018
- April 2018
- March 2018
- February 2018
- January 2018
- December 2017
- November 2017
- October 2017
- September 2017
- August 2017
- July 2017
- June 2017
- May 2017
- April 2017
- March 2017
- February 2017
- January 2017
- December 2016
- November 2016
- October 2016
- September 2016
- August 2016
- July 2016
- June 2016
- May 2016
- April 2016
- March 2016
- February 2016
- January 2016
- December 2015
- November 2015
- October 2015
- September 2015
- August 2015
- July 2015
- June 2015
- May 2015
- April 2015
- March 2015
- February 2015
- January 2015
- December 2014
- November 2014
- October 2014
- September 2014
- August 2014
- July 2014
- June 2014
- May 2014
- April 2014
- March 2014
- February 2014
- January 2014
- December 2013
- November 2013
- October 2013
- September 2013
- August 2013
- July 2013
- June 2013
- May 2013
- April 2013
- March 2013
- February 2013
- January 2013
- December 2012
- November 2012
- October 2012
- September 2012
- August 2012
- July 2012
- June 2012
- May 2012
- April 2012
- March 2012
- February 2012
- January 2012
- December 2011
- November 2011
- October 2011
- September 2011
- August 2011
- July 2011
- June 2011
- May 2011
- April 2011
- March 2011
- February 2011
- January 2011
- December 2010
- November 2010
- October 2010
- September 2010
- August 2010
- July 2010
- June 2010
- May 2010
- April 2010
- March 2010
- February 2010
- January 2010
- December 2009
- November 2009
- October 2009
- September 2009
- August 2009
- July 2009
- June 2009
- May 2009
- April 2009
- March 2009
- February 2009
- January 2009
- December 2008
- November 2008
- October 2008
- September 2008
- August 2008
- July 2008
- June 2008
- May 2008
- April 2008
- March 2008
- February 2008
- January 2008
- December 2007
- November 2007
- October 2007
- September 2007
- August 2007
- July 2007
- June 2007
- May 2007
- April 2007
- March 2007
- February 2007
- January 2007
- December 2006
- November 2006
- October 2006
- September 2006
- August 2006
- July 2006
- June 2006
- May 2006
- April 2006
- March 2006
- February 2006
- January 2006
- December 2005
- November 2005
- October 2005
- September 2005
- August 2005
- July 2005
 Eddy Elfenbein is a Washington, DC-based speaker, portfolio manager and editor of the blog Crossing Wall Street. His