-
A Closer Look at Respironics
Posted by Eddy Elfenbein on December 6th, 2006 at 11:55 amMany years ago, when I got my first job in finance, I worked for a sleazy brokerage firm in Boston. This place was truly rock bottom. I was just out of school and it was the only job I could get. This firm made the Boiler Room look like Goldman Sachs.
All day long, I cold called people in and around Boston. I guess with the advent of cell phones, cold calling has gone away. But that’s all I had to go on. I didn’t even have my own desk. Several of us where bunched around a table loaded with phones, and we had stacks of Boston white pages. Even thinking about it is giving me chills.
The place was more like a frat house than a place of business. I finally had enough so I applied for a job in the research department. The head of the department told me to write a report on Respironics (RESP). So I rolled up my sleeves and got to work. I collected everything on the company I could find. I read up on sleep apnea. I read all of the company’s SEC filings. I read other companies reports. I called experts. For several days, I did nothing but eat and sleep Respironics.
When I finally wrote my report, I concluded that Resprionics’ stock was fairly valued. That was my big mistake. Well, I was right—the stock was fairly valued. But I soon learned that it was research director’s absolute favoritest stock in the whole wide world. As you can imagine, he hated my report and I didn’t get the job. So much for open-minded Wall Street research.
Ever since then, Respironics has had a special place in my heart. After I wrote my report, the stock flatlined for several months. Just as I thought, it was fairly valued. But in the long run, the research director was right, it’s been a very good stock.
For the past year, however, Respironics hasn’t done much. Here’s a look at the stock’s performance:
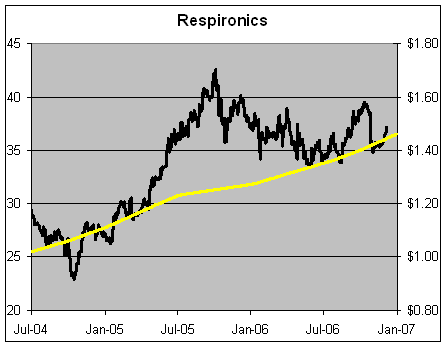
The yellow line (right scale) is the company’s earnings-per-share. The two scales are aligned 25 to 1, so when the lines cross, the P/E ratio is 25. -
The Worst CEO of the Year
Posted by Eddy Elfenbein on December 6th, 2006 at 9:45 amHerb Greenberg offers the award of 2006’s Worst CEO to Ilia Lekach of Parlux (PARL). Parlux is the company behind Paris Hilton’s perfume. Need we say more. Patrick Byrne of Overstock.com (OSTK) came in second. Once again, need we say more.
Congratulations to all our contestants. Better luck next year! -
Depressing Fact of the Day
Posted by Eddy Elfenbein on December 5th, 2006 at 12:24 pmFrom John Fund:
Last year, of the 25 largest initial public offerings in the world, only one took place in America. This year, Hong Kong is likely to end up as the No. 1 market for stock offerings world-wide.
-
Happy Birthday Irrational Exuberance
Posted by Eddy Elfenbein on December 5th, 2006 at 10:22 amIt was 10 years ago today that Alan Greenspan made his famous “irrational exuberance” speech. Here’s the money paragraph:
Clearly, sustained low inflation implies less uncertainty about the future, and lower risk premiums imply higher prices of stocks and other earning assets. We can see that in the inverse relationship exhibited by price/earnings ratios and the rate of inflation in the past. But how do we know when irrational exuberance has unduly escalated asset values, which then become subject to unexpected and prolonged contractions as they have in Japan over the past decade? And how do we factor that assessment into monetary policy? We as central bankers need not be concerned if a collapsing financial asset bubble does not threaten to impair the real economy, its production, jobs, and price stability. Indeed, the sharp stock market break of 1987 had few negative consequences for the economy. But we should not underestimate or become complacent about the complexity of the interactions of asset markets and the economy. Thus, evaluating shifts in balance sheets generally, and in asset prices particularly, must be an integral part of the development of monetary policy.
It doesn’t seem that dramatic, but at the time, it was taken very seriously. The next day, the Dow dropped 55 points. Since then, the market has more than doubled. The S&P 500 has gone up about 90%, plus there’s another 17% from dividends. Inflation is up about 28%.
-
Six-Year High
Posted by Eddy Elfenbein on December 4th, 2006 at 8:57 pm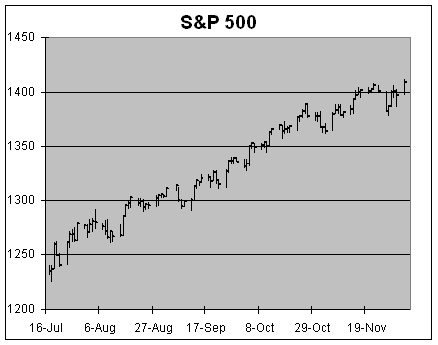
The S&P 500 rallied to its highest close since November 8, 2000. If you recall, that was the day after the election when we were trying to figure out exactly who won.
Since July 17, the S&P has climbed 14.1%. Our Buy List has done a little better, rising 15.5%. Remarkable, the P/E ratio for the S&P 500 is still lower than it was in May. Since late-June, the yield on the 10-year bond has dropped 81 basis points, from 5.24% to 4.43%. I don’t see how this rally can end just yet. But it probably needs to take a rest soon.
Two quick things to mention. Medtronic (MDT) said that it’s going to spin off its external defibrillator business. This should happen some time next year. Also, UnitedHealth (UNH) announced that it has a new CEO. Stephen J. Hemsley has replaced William McGuire who was embroiled in the stock options (ahem) “scandal.” The stock is now going for about 14 times where the company sees next year’s earnings. Honestly, UNH hasn’t been this cheap in years. -
Pfizer and the Dow
Posted by Eddy Elfenbein on December 4th, 2006 at 3:02 pmWell, it turns out that Pfizer‘s (PFE) turnaround, isn’t quite turning around. The company’s blockbuster new drug to replace Lipitor apparently has some problems.
Here’s something interesting: Even though Pfizer is getting slammed by over 11% today, because the Dow is weighted by price, the sell-off isn’t having a very big impact. By market value, Pfizer is the ninth-largest Dow stock (true, it was higher last week). The company makes up about 4.4% of the Dow’s total value, which is about $4 trillion. However, Pfizer’s low price means that it makes up just 1.6% of the Dow.
GM is by far the biggest moocher in the Dow. It has a larger weighting in the Dow than Microsoft even though MSFT’s market value is 17 times larger! This is why I follow the S&P 500. -
Two Huge Buyouts This Morning
Posted by Eddy Elfenbein on December 4th, 2006 at 9:18 amIt turns out that the Home Depot (HD) buyouts rumors were completely unfounded, but the mergers are still coming. This morning, Bank of New York (BK) announced that it’s hitching up with Mellon Financial (MEL).
Here’s a weird twist. Both banks have been led by Secretaries of the Treasury. No, really!
Mellon Financial dates back to 1869 when it was started by Thomas Mellon, the father of the future Treasury Secretary, Andrew Mellon.
The Bank of New York is one of the oldest companies in America. It was founded by Alexander Hamilton, our first SecTreas. (He was also the guy who…um..lost the duel.) BNY was the first stock ever traded on the NYSE.
The other news is LSI Logic (LSI) is buying up Agere (AGR) for $4 billion. I can’t prove this, but I’ve always believed that a secret part of the government’s breakup plan for AT&T was to have each spinoff have a worse and worse name (Lucent, Avaya). Just a hunch. -
The New CNBC.com is Live
Posted by Eddy Elfenbein on December 4th, 2006 at 8:44 amCNBC.com is now live. Quick, sign up before all the good usernames are taken.
The site’s design seems a bit….busy. Also, it’s somewhat clunky to navigate, but I’m happy to see some blogs listed under the News & Analysis tab. The site lists seven featured blogs, along with another seven program blogs.
Here’s something very cool. Under the Investing Tools section, enter a stock symbol and click on earnings history. The company’s EPS pops up for the past several quarters. I like it! -
First They Came for the Reindeer….
Posted by Eddy Elfenbein on December 2nd, 2006 at 12:48 pm
Yikes! The War Against Christmas is much worse than I thought.
(Hat Tip: Agatha.) -
A Look at the Very Long Term
Posted by Eddy Elfenbein on December 1st, 2006 at 12:27 pmThrough yesterday, the S&P 500 is up 12.2% for the year, and 14.2% including dividends.
Going back to 1925, the stock market is up over 300,000% (I’m using numbers from Ibbotson Associates, plus I’ve added my own to fill in the gaps). Over the last 80 years and 11 months, the stock market has gained an average of 10.24% a year, that’s including dividends. Inflation has averaged just over 3% a year, and the after-inflation return of equities works out to 7.16% a year. That means that, on average, stocks double their value, in real terms, every ten years.
Here’s a graph of the after-inflation total return of stocks going back to 1925. It’s a logarithmic chart, and I’ve included a 7% trend line for perspective:
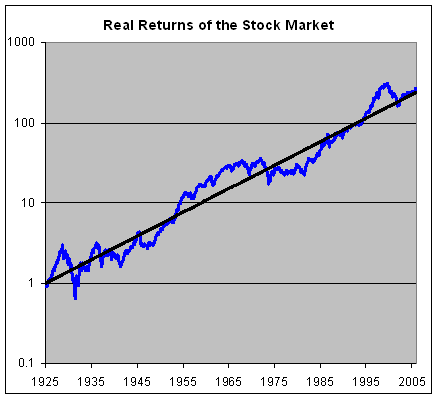
I think it’s interesting that the market soared above its trend line in the mid-50s, and stayed there for about twenty years. It then sank below it for the next several years. In fact, hugging the trend line, as we have recently, seems to the unusual pattern. It’s also interesting that 1987 now only appears as a little blip.
Here’s the chart again, but this time I divided the stock market line by the trend line:
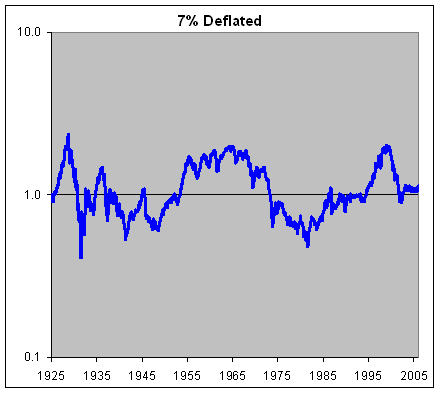
We’re still smack in the middle of the long-term trend.
-
Archives
- June 2026
- May 2026
- April 2026
- March 2026
- February 2026
- January 2026
- December 2025
- November 2025
- October 2025
- September 2025
- August 2025
- July 2025
- June 2025
- May 2025
- April 2025
- March 2025
- February 2025
- January 2025
- December 2024
- November 2024
- October 2024
- September 2024
- August 2024
- July 2024
- June 2024
- May 2024
- April 2024
- March 2024
- February 2024
- January 2024
- December 2023
- November 2023
- October 2023
- September 2023
- August 2023
- July 2023
- June 2023
- May 2023
- April 2023
- March 2023
- February 2023
- January 2023
- December 2022
- November 2022
- October 2022
- September 2022
- August 2022
- July 2022
- June 2022
- May 2022
- April 2022
- March 2022
- February 2022
- January 2022
- December 2021
- November 2021
- October 2021
- September 2021
- August 2021
- July 2021
- June 2021
- May 2021
- April 2021
- March 2021
- February 2021
- January 2021
- December 2020
- November 2020
- October 2020
- September 2020
- August 2020
- July 2020
- June 2020
- May 2020
- April 2020
- March 2020
- February 2020
- January 2020
- December 2019
- November 2019
- October 2019
- September 2019
- August 2019
- July 2019
- June 2019
- May 2019
- April 2019
- March 2019
- February 2019
- January 2019
- December 2018
- November 2018
- October 2018
- September 2018
- August 2018
- July 2018
- June 2018
- May 2018
- April 2018
- March 2018
- February 2018
- January 2018
- December 2017
- November 2017
- October 2017
- September 2017
- August 2017
- July 2017
- June 2017
- May 2017
- April 2017
- March 2017
- February 2017
- January 2017
- December 2016
- November 2016
- October 2016
- September 2016
- August 2016
- July 2016
- June 2016
- May 2016
- April 2016
- March 2016
- February 2016
- January 2016
- December 2015
- November 2015
- October 2015
- September 2015
- August 2015
- July 2015
- June 2015
- May 2015
- April 2015
- March 2015
- February 2015
- January 2015
- December 2014
- November 2014
- October 2014
- September 2014
- August 2014
- July 2014
- June 2014
- May 2014
- April 2014
- March 2014
- February 2014
- January 2014
- December 2013
- November 2013
- October 2013
- September 2013
- August 2013
- July 2013
- June 2013
- May 2013
- April 2013
- March 2013
- February 2013
- January 2013
- December 2012
- November 2012
- October 2012
- September 2012
- August 2012
- July 2012
- June 2012
- May 2012
- April 2012
- March 2012
- February 2012
- January 2012
- December 2011
- November 2011
- October 2011
- September 2011
- August 2011
- July 2011
- June 2011
- May 2011
- April 2011
- March 2011
- February 2011
- January 2011
- December 2010
- November 2010
- October 2010
- September 2010
- August 2010
- July 2010
- June 2010
- May 2010
- April 2010
- March 2010
- February 2010
- January 2010
- December 2009
- November 2009
- October 2009
- September 2009
- August 2009
- July 2009
- June 2009
- May 2009
- April 2009
- March 2009
- February 2009
- January 2009
- December 2008
- November 2008
- October 2008
- September 2008
- August 2008
- July 2008
- June 2008
- May 2008
- April 2008
- March 2008
- February 2008
- January 2008
- December 2007
- November 2007
- October 2007
- September 2007
- August 2007
- July 2007
- June 2007
- May 2007
- April 2007
- March 2007
- February 2007
- January 2007
- December 2006
- November 2006
- October 2006
- September 2006
- August 2006
- July 2006
- June 2006
- May 2006
- April 2006
- March 2006
- February 2006
- January 2006
- December 2005
- November 2005
- October 2005
- September 2005
- August 2005
- July 2005
 Eddy Elfenbein is a Washington, DC-based speaker, portfolio manager and editor of the blog Crossing Wall Street. His