-
Morning News: January 6, 2021
Posted by Eddy Elfenbein on January 6th, 2021 at 7:04 amU.S. 10-Year Treasury Yield Hits 1% for First Time Since March
Saudi Arabia Will Cut Its Oil Production, Allowing Russia’s to Grow
NYSE May Make Second U-turn on China Telecom Delistings Amid Confusion Over Policy
Trump Bars U.S. Transactions with Eight Chinese Apps Including Alipay
UnitedHealth to Buy Change Healthcare for $7.84 Billion to Build Up Technology Services
AmerisourceBergen to Buy Walgreens’ Distribution Business in $6.5 Billion Deal
Environmental Debt Risk Is Bigger Than Japan’s GDP
The 10 Ways Renewable Energy’s Boom Year Will Shape 2021
Henry Paulson Returns to Finance, to Run Climate-Focused Fund
Starburst Data Hits $1.2 Billion Valuation as Andreessen Invests
Amazon Buys Planes From Airlines Struggling With Pandemic Slowdown
Buffett Loses Spot on Wealthy List to China’s Bottled Water King
Ben Carlson: Updating My Favorite Performance Chart For 2020
Michael Batnick: One of The Great Bubbles of Financial History
Joshua Brown: There’s No Such Thing As A Local Advisor Anymore, It’s Worth What the Buyers and Sellers Believe It’s Worth & Bubbles Always Burst in January?
Be sure to follow me on Twitter.
-
Strongest ISM in Two Years
Posted by Eddy Elfenbein on January 5th, 2021 at 1:17 pmMost of Wall Street seems to be focused on the state of Georgia today and its two Senate races. These may decide who controls power on Capitol Hill.
After a rough trading day yesterday, the stock market is making back some of those losses today. So far, cyclical stocks and small-caps look strong. Value is outpacing growth. Energy stocks are exceptionally strong today.
This morning’s ISM Manufacturing report looked pretty good. It came in at 60.7 which is the best number since August 2018.
The ISM’s index of national factory activity rebounded to a reading of 60.7 last month. That was the highest level since August 2018 and followed a reading of 57.5 in November. A reading above 50 indicates expansion in manufacturing, which accounts for 11.9% of the U.S. economy. Economists polled by Reuters had forecast the index would slip to 56.6 in December.
But some of the surprise rebound in the ISM index was due to an increase in the survey’s measure of supplier deliveries to a reading of 67.6 last month from 61.7 in November.
A lengthening in suppliers’ delivery times is normally associated with a strong economy and increased customer demand, which would be a positive contribution. But in this case slower supplier deliveries also indicate supply shortages related to the pandemic.
This is jobs week. Tomorrow, we’ll get the ADP private payroll report. Then on Thursday, another jobless claims report. On Friday, the big December jobs report comes out. I suspect that this may be a weak report.
-
Morning News: January 5, 2021
Posted by Eddy Elfenbein on January 5th, 2021 at 7:02 amUltra-Low Interest Rates Are Here to Stay: 2021 Central Bank Guide
Hedge Funds Raise Mining Shorts As COVID Vaccines Seen Tamping Gold Gains
In a Topsy-Turvy Pandemic World, China Offers Its Version of Freedom
NYSE Scraps Plan to Delist China Telcos in ‘Bizarre’ U-Turn
$900 Billion Won’t Carry Biden Very Far
Drugmakers Kick Off 2021 with 500 U.S. Price Hikes
Lineage Logistics Makes $500 Million Bet on Refrigerated Rail
A Simple Way to End Questionable Stock Trading by Lawmakers
Auto Sales in 2020 Expected to Hit Lowest Point in Nearly a Decade
Why Solar Energy Stocks Can Beat the Market Again in 2021
Haven, the Amazon-Berkshire-JPMorgan Venture to Disrupt Health Care, is Disbanding After 3 Years
Nick Maggiulli: Why I’ve Changed My Mind on Bitcoin
Howard Lindzon: Momentum Monday….Let’s Travel?
Cullen Roche: Three Things I Think I Think – Happy New Year!
Ben Carlson: Inflation Truthers
Be sure to follow me on Twitter.
-
The Dividend Indicator May No Longer Work
Posted by Eddy Elfenbein on January 4th, 2021 at 12:08 pmHere’s the S&P 500 (blue line, left scale) and its dividends (black line, right scale). The two lines are scaled at a ratio of 50-to-1, meaning the yield is 2% whenever the lines cross.
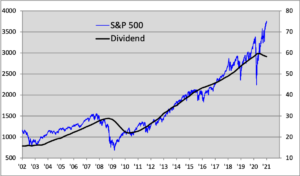
Over the last 20 years, 2% has worked decently well as a fair value estimate, except for an 18-month stretch during the financial crisis.
The relationship started to break down in 2020 as many companies have suspended their dividends. For 2020, dividend payments rose but very slightly.
The chart may look scarier than it really is. The problem with any valuation measure is that the underlying factors may have changed. That could be happening here.
-
2021 Opens on a Down Note
Posted by Eddy Elfenbein on January 4th, 2021 at 10:41 amThe stock market opened 2021 on an up note, but we’ve already slid back into negative territory. On our Buy List, we’ve had new highs from Ansys (ANSS), Intercontinental Exchange (ICE), Stryker (SYK) and one of our newbies this year, Miller Industries (MLR).
(By the way, Senator Kelly Loeffler of Georgia, who is on the ballot tomorrow to fill out the rest of that term, is the wife of ICE’s CEO Jeffrey Sprecher. In no way is this a comment on the election or politics in general. I just wanted to point out this fact.)
Energy and Materials are doing well this morning, in a relative sense. Dividend stocks are doing the worst. This morning, we learned that construction spending rose 0.4% in November. In a few weeks, we’ll get our first look at Q4 GDP growth. So far, analysts seem to be all over the map. This Friday, we’ll get the December jobs report.
Also, Dogecoin jumped 125% in one day. This was due to improved fundamentals. No, I’m kidding. An adult actress tweeted about it.
-
Morning News: January 4, 2021
Posted by Eddy Elfenbein on January 4th, 2021 at 7:07 amBitcoin Falls Most Since March as Volatility Grips Trading
As Some Deficit Hawks Turn Dove, the New Politics of Debt Are on Display
2021 Will Be the Year of Guaranteed Income Experiments
Hundreds of Google Employees Unionize, Culminating Years of Activism
Peugeot Shareholders Approve Autos Mega-Merger with Fiat
MGM Makes $11 Billion Offer for Ladbrokes Owner Entain
Centene to Acquire Magellan Health in $2.2 Billion Deal
Roku Nears Deal to Buy Rights to Quibi’s Content
Wall Street Eyes Billions in the Colorado’s Water
‘A Slap in the Face’: The Pandemic Disrupts Young Oil Careers
Looming Delisting Jolts Chinese Telecom Stocks
Ben Carlson: Animal Spirits: The Best of 2020 & Drawdowns & Melt-Ups: The Year That Was in the Markets
Michael Batnick: The Year of Stimulus, and Other Great Charts & Advice for Giving Advice
Howard Lindzon: Selling Early… And Bitcoin Recap
Joshua Brown: Have Some Fun in ‘21 & Promises
Be sure to follow me on Twitter.
-
The S&P 500 Total Return Index (1936)
Posted by Eddy Elfenbein on January 2nd, 2021 at 10:20 pmIn addition to the S&P 500, the index provider also has an S&P 500 Total Return Index. It’s the same as the S&P 500 but dividends are reinvested.
The S&P 500 Total Return Index closed 2020 at 7,759.35. I believe that that index starts in 1987. Since the S&P 500 is currently at 3,756.07, that means that dividends have more than doubled the return of the index over that time. That comes out to a gain of 2.2% per year from dividends. Over the long haul, dividends really do make a big difference.
The S&P 500 also has an S&P 500 Total Return Index that has 1936 as a base. That actually goes back to before the S&P 500 had 500 stocks. That didn’t happen until 1957.
For reasons I can’t imagine, you can find this index quoted at Morningstar. Let’s dig in.
If you had started investing on March 31, 1936 and had reinvested your dividends, through Thursday, you would have registered a gain of 543,755.05%.
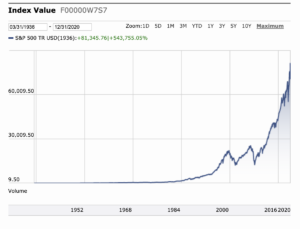
That was enough to turn $10,000 into more than $54 million. (I hate those kinds of stats.)
The return works out to 10.68% per year. That’s enough to double your month every six years and ten months.
-
True
Posted by Eddy Elfenbein on January 2nd, 2021 at 4:08 pmTo everyone who got into trading stocks this year, I have a little hard truth for you: You're not actually that good at it. You just caught a wild bull market. Take some money off the table.
— Chris Sacca 🇺🇸 (@sacca) December 23, 2020
-
CWS Market Review – January 1, 2021
Posted by Eddy Elfenbein on January 1st, 2021 at 2:07 pmHappy New Year!
The 2020 trading year has come to a close. This was a very difficult year for many of us. I’ll admit that I’m not sorry to see 2020 go. I’ll get to our performance in 2020 in a bit, but first let’s look at the 2021 Buy List.
The 2021 Buy List
Here are the 25 stocks for the 2021 Buy List. It’s locked and sealed, and I can’t make any changes for 12 months.
For tracking purposes, I assume the Buy List is a $1 million portfolio that’s equally divided among 25 stocks. Below are all 25 positions with the number of shares for each and the closing price for 2020. Whenever I discuss how the Buy List is doing, the list below is what I’m referring to.
Company Ticker Price Shares Balance Abbott Laboratories ABT $109.49 365.330167 $40,000.00 AFLAC AFL $44.47 899.482797 $40,000.00 Ansys ANSS $363.80 109.950522 $40,000.00 Broadridge Financial Solutions BR $153.20 261.096606 $40,000.00 Cerner CERN $78.48 509.683996 $40,000.00 Check Point Software CHKP $132.91 300.955534 $40,000.00 Church & Dwight CHD $87.23 458.557836 $40,000.00 Danaher DHR $222.14 180.066625 $40,000.00 Disney DIS $181.18 220.774920 $40,000.00 FactSet FDS $332.50 120.300752 $40,000.00 Fiserv FISV $113.86 351.308625 $40,000.00 HEICO HEI $132.40 302.114804 $40,000.00 Hershey HSY $152.33 262.587803 $40,000.00 Intercontinental Exchange ICE $115.29 346.951167 $40,000.00 Middleby MIDD $128.92 310.269935 $40,000.00 Miller Industries MLR $38.02 1,052.077854 $40,000.00 Moody’s MCO $290.24 137.816979 $40,000.00 Ross Stores ROST $122.81 325.706376 $40,000.00 Sherwin-Williams SHW $734.91 54.428433 $40,000.00 Silgan SLGN $37.08 1,078.748652 $40,000.00 Stepan SCL $119.32 335.232987 $40,000.00 Stryker SYK $245.04 163.238655 $40,000.00 Thermo Fisher TMO $465.78 85.877453 $40,000.00 Trex TREX $83.72 477.783086 $40,000.00 Zoetis ZTS $165.50 241.691843 $40,000.00 Total $1,000,000.00 The five new stocks are Abbott Laboratories (ABT), HEICO (HEI), Miller Industries (MLR), Thermo Fisher Scientific (TMO) and Zoetis (ZTS).
The five sells are Becton, Dickinson (BDX), Eagle Bancorp (EGBN), Globe Life (GL), Hormel Foods (HRL) and RPM International (RPM).
Disney (DIS) is our largest stock, with a market cap of $328 billion. The Buy List is mostly large- and mid-cap stocks. Miller Industries (MLR) is our smallest stock, with a market cap of $434 million. Stepan (SCL) is the next smallest, and it’s six times larger than Miller.
Only AFLAC (AFL) and Fiserv (FISV) have been on the Buy List all 16 years. This is Stryker’s (SYK) 14th year.
Here are brief descriptions (via Hoovers) of our five new stocks:
With activities ranging from filling baby bottles to making generic medications and cardiovascular devices, Abbott Laboratories (ABT) is a diverse healthcare-products manufacturer. Its cardiovascular and neuromodulation segment makes products for cardiac-rhythm management, electrophysiology and other areas of cardiovascular care. Abbott’s diagnostics division makes laboratory testing systems and point-of-care tests. The nutritional-products division makes such well-known brands as Similac infant formula and Ensure supplements. Abbott also sells branded generic medicines (including gastroenterology and women’s-health products) in emerging markets and makes the FreeStyle diabetes-care line. Buy up to $120 per share.
As one of the world’s largest independent providers of aircraft replacement parts, HEICO Corporation (HEI) helps jets get airborne. Its flight-support group makes FAA-approved replacement parts for jet engines that can be substituted for original parts, including airfoils, bearings and fuel pump gears. Flight support also repairs, overhauls and distributes jet engine parts, as well as avionics and instruments for commercial air carriers. HEICO’s second segment, the electronic-technologies group, makes a variety of electronic equipment for the aerospace/defense, electronic, medical and telecommunications industries. The company generates about 65% of its revenue in the US. Buy up to $140.
This body builder wants to pump up your chassis. Miller Industries (MLR) makes bodies for light- and heavy-duty wreckers, along with car carriers and multi-vehicle trailers. It serves as the official recovery team at some of the NASCAR races (including Talladega), as well as the Indy 500 races. Miller makes its recovery and towing vehicles at plants in the US and Europe. Its multi-vehicle transport trailers can carry as many as eight vehicles and loads of up to 75 tons. Miller Industries’ US brand names include Century, Challenger, Champion, Chevron, Eagle, Holmes, Titan and Vulcan. The company’s European brands are Jige (France) and Boniface (UK). Miller and rival Jerr-Dan dominate the US market for wrecker bodies. Buy up to $42.
Thermo Fisher Scientific (TMO) preps the laboratory for research, analysis, discovery or diagnostics. The company makes and distributes analytical instruments, scientific equipment, consumables and other laboratory supplies. Products range from chromatographs and spectrometers to Erlenmeyer flasks, fume hoods and gene sequencers. Moving into other areas, it also offers testing and manufacturing of drugs, including biologicals. Thermo Fisher also provides specialty diagnostic testing products, as well as clinical analytical tools. The company tallies more than 400,000 customers worldwide. Its key markets are pharmaceutical and biotech, diagnostics and health care, academic and government, and industrial and applied research. Nearly half of the company’s sales were generated in the US. Buy up to $490.
Whether you have cats or cattle, Zoetis (ZTS) has medicines to keep them healthy. The company manufactures and sells veterinary products such as parasiticides (to protect against fleas, ticks and worms), anti-infectives, medicated feed additives, vaccines and other pharmaceuticals for companion and farm animals. Zoetis boasts more than 300 product lines sold in more than 100 countries around the world, making it one of the world’s largest animal-health businesses. In addition to medications and vaccines, Zoetis offers diagnostics, genetic tests, biodevices and a range of services. About half of the company’s total revenue is generated from the US. Buy up to $180.
The 2020 Buy List
Now let’s look at how we did last year. For 2020, the S&P 500 gained 16.26% while our Buy List gained 16.79%. However, once we include dividends, then the S&P 500 gained 18.40% while our Buy List gained 17.93%.
So we lost to the overall market by less than 0.5%. In our defense, we managed to keep with the market in a very difficult year. We didn’t own any of the tech behemoths that saw tremendous gains in 2020. To give you an example, the S&P 500 Equal Weight index, which weighs every member the same, gained 10.47% in 2020. That means we beat most stocks.
For the long-term, we’ve done quite well. Over the last 15 years, our Buy List has gained 383.05% while the S&P 500 has gained 311.00%.
Our biggest winner in 2020 was Trex (TREX), which gained over 86%. Danaher (DHR) and Ansys (ANSS) were second and third, respectively. AFLAC (AFL) was our worst performer in 2020, which is very unusual for the duck stock.
For people who care about such things, the “beta” of our Buy List in 2020 was 0.9246. The correlation of the daily changes of the Buy List to the changes of the S&P 500 was 96.52%.
The chart below details our Buy List’s performance. I’ve listed each stock, along with the number of shares and the starting and ending prices. For tracking purposes, I assume the Buy List is a $1 million portfolio that starts out equally divided among the 25 stocks.
 Eddy Elfenbein is a Washington, DC-based speaker, portfolio manager and editor of the blog Crossing Wall Street. His