-
Right Where We Left Off
Posted by Eddy Elfenbein on January 2nd, 2020 at 10:48 amHappy New Year!
The stock market is getting started on a good note.
Things will get a lot more interesting soon, once earnings season starts.
Shares of Disney (DIS) are off to a nice start:
Disney shares were on the rise to kick off 2020 after some Wall Street analysts estimated significant growth from its new streaming service and recommended clients keep buying the stock.
Rosenblatt Securities analyst Bernie McTernan expects Disney+ to attract 25 million users by the end of the first quarter of 2020, he said in a note Wednesday. He previously estimated that figure to be 21 million subscribers.
“Following results from our 4th streaming video survey over the past 3 months we are raising our estimates for Disney+, now assuming 25M subscribers globally at the end of FY1Q20, up from 21M prior,” he said. “Awareness of the service and penetration of respondents has continued to trend higher throughout our surveys.”
McTernan reiterated a $175 price target and a buy rating on Disney, and added that the growth of Disney+ may be pulling some users away from Netflix.
On the econ front, this morning’s jobless claims report fell by 2,000 to 222,000. That’s a good number. We’ll learn a lot more next Friday, January 10, when the government releases the job stats for December. The unemployment rate is currently near a 50-year low.
Here’s an interesting stat from the Stock Trader’s Almanac: When stocks finish the first five days higher, the S&P 500 has been positive more than 80% of the time at year-end with an average gain of about 13%.
-
Morning News: January 2, 2020
Posted by Eddy Elfenbein on January 2nd, 2020 at 6:55 amOne of Chinese Leaders’ Biggest Worries for 2020 Is Pork
China Halts British Stock Link Over Political Tensions
Trump Administration is Quietly “Gutting” Tax Law to Give Big New Breaks to Corporations
The Dollar’s Losses May Just Be Getting Started
Here’s (Almost) Everything Wall Street Expects in 2020
Private Equity Is Starting 2020 With More Cash Than Ever Before
U.S. Shale Producers to Tap Brakes in 2020 After Years of Rapid Growth
HSBC Kicks Off Year with Hong Kong Branches Closed, Vandalized
BAE to Get Green Light for $10 Billion Howitzer Project
Pika-Who? How Pokémon Go Confused the Canadian Military
Japan Tries to Solve the Mystery of Carlos Ghosn’s Audacious Escape
France Wouldn’t Extradite Carlos Ghosn if He Went There, Official Says
Cullen Roche: What Should You Do When the Stock Market Goes Bonkers?
Howard Lindzon: Happy New Year – 2020 Here We Come
Be sure to follow me on Twitter.
-
CWS Market Review – January 1, 2020
Posted by Eddy Elfenbein on January 1st, 2020 at 2:36 pmHappy New Year!
The 2019 trading year has come to a close. It was a very good year for Wall Street and for us. I’ll get to our performance in 2019 in a bit, but first let’s look at the 2020 Buy List.
The 2020 Buy List
Here are the 25 stocks for the 2020 Buy List. It’s locked and sealed, and I can’t make any changes for 12 months.
For tracking purposes, I assume the Buy List is a $1 million portfolio that’s equally divided among 25 stocks. Below are all 25 positions with the number of shares for each and the closing price for 2019. Whenever I discuss how the Buy List is doing, the list below is what I’m referring to.
Company Ticker Price Shares Balance AFLAC AFL $52.90 756.14367 $40,000.00 Ansys ANSS $257.41 155.39412 $40,000.00 Becton, Dickinson BDX $271.97 147.07505 $40,000.00 Broadridge Financial Solutions BR $123.54 323.78177 $40,000.00 Cerner CERN $73.39 545.03338 $40,000.00 Check Point Software CHKP $110.96 360.49027 $40,000.00 Church & Dwight CHD $70.34 568.66648 $40,000.00 Danaher DHR $153.48 260.62028 $40,000.00 Disney DIS $144.63 276.56779 $40,000.00 Eagle Bancorp EGBN $48.63 822.53753 $40,000.00 FactSet Research Systems FDS $268.30 149.08684 $40,000.00 Fiserv FISV $115.63 345.93099 $40,000.00 Globe Life GL $105.25 380.04751 $40,000.00 Hershey HSY $146.98 272.14587 $40,000.00 Hormel Foods HRL $45.11 886.72135 $40,000.00 Intercontinental Exchange ICE $92.55 432.19881 $40,000.00 Middleby MIDD $109.52 365.23009 $40,000.00 Moody’s MCO $237.41 168.48490 $40,000.00 Ross Stores ROST $116.42 343.58358 $40,000.00 RPM International RPM $76.76 521.10474 $40,000.00 Sherwin-Williams SHW $583.54 68.54714 $40,000.00 Silgan SLGN $31.08 1287.00129 $40,000.00 Stepan SCL $102.44 390.47247 $40,000.00 Stryker SYK $209.94 190.53063 $40,000.00 Trex TREX $89.88 445.03783 $40,000.00 Total $1,000,000.00 The five new stocks are Ansys (ANSS), Middleby (MIDD), Silgan (SLGN), Stepan (SCL) and Trex (TREX).
The five sells are Continental Building Products (CBPX), Cognizant Technology Solutions (CTSH), Raytheon (RTN), JM Smucker (SJM) and Signature Bank (SBNY).
Disney (DIS) is our largest stock, with a market cap of $261 billion. The Buy List is mostly large- and mid-cap stocks. Four of the five new buys for this year are our only stocks with market caps less than $10 billion. That’s not a strategic decision on my part. It just worked out that way.
Only AFLAC (AFL) and Fiserv (FISV) have been on the Buy List all 15 years. This is Stryker’s (SYK) 13th year.
Here’s a brief description (via Hoovers) of our five new stocks:
It’s good to look before you leap – and even before you make. That’s why ANSYS (ANSS) helps designers and engineers see how their ideas play out even before a prototype is built by simulating designs on a computer. The company’s software analyzes the models for their response to combinations of such physical variables as stress, pressure, impact, temperature, and velocity. Ranging from small consulting firms to multinational enterprises, its 40,000 customers come from a broad range of industries and include QualComm, Ford, TechnipFMC, Medtronic, and Speedo. Pennsylvania-based ANSYS generates about 60% of revenue from outside the US, with Japan and Germany among its leading international markets. Buy below $270.
Founded in 1888, Middleby (MIDD) makes a slew of commercial and institutional foodservice equipment for restaurants, retailers, and hotels worldwide. Middleby operates through three segments: Commercial Foodservice Equipment, Food Processing Equipment, and Residential Kitchen Equipment. The largest, Foodservice, makes machines for most types of cooking and warming activities. Products are sold under about 50 blue chip brands – Anets, Blodgett, Southbend, and TurboChef, among them. Residential Kitchen makes ovens, refrigerators, dishwashers, microwaves, and other related products, and Food Processing makes cooking, mixing, slicing, and packaging machines. About two-thirds of sales come from the US and Canada. Buy below $120.
Silgan Holdings (SLGN) is one of the leading makers of metal containers in the world, and in North America, it holds the #1 position in metal food containers. Its containers are used by customers such as Campbell’s Soup, Del Monte, and Nestlé to package soups, vegetables, meat, seafood, and pet food. Through its Silgan Dispensing Systems business, the company supplies highly engineered triggers, pumps, sprayers and dispensing closure solutions for health care, garden, home, and beauty and food products. Silgan also makes plastic containers used by personal care, pharmaceutical, and other companies. About 80% of its revenue comes from North America. Buy below $34.
Stepan Company (SCL) makes basic and intermediate chemicals, including surfactants, specialty products, phthalic anhydride, and polyurethane polyols. Surfactants, the company’s largest business, are used in cleaning agents and consumer products like detergents, toothpastes, and cosmetics. Stepan’s surfactants also have commercial and industrial applications ranging from emulsifiers for agricultural insecticides to agents used in oil recovery. The company also makes phthalic anhydride and other polymers, in addition to specialty chemicals for food and pharmaceutical uses. The US is Stepan’s biggest market. Buy below $110.
Trex Company (TREX) is all decked out with plenty of places to go. It’s the world’s largest maker of wood-alternative decking and railing products, which are used in the construction of residential and commercial decks, rails, and trims. Marketed under the Trex name, products resemble wood and have the workability of wood, but require less long-term maintenance. The Trex Wood-Polymer composite is made of waste wood fibers and reclaimed plastic. Trex serves professional installation contractors and do-it-yourselfers through about 90 wholesale distribution centers, which in turn sell to retailers including Home Depot and Lowe’s. Trex products are available in more than 5,500 locations, primarily in the US and Canada. Buy below $97.
The 2019 Buy List
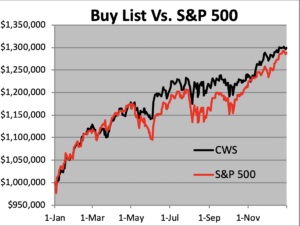
Now let’s look at how we did last year. As it turned out, we beat the market by eight basis points, or 0.08%. This was a close finish.
For 2019, the S&P 500 gained 28.88% while our Buy List gained 29.99%. Including dividends, the S&P 500 gained 31.49% while our Buy List gained 31.57%.
By August, our Buy List had a 6% lead over the market, but much of that eroded away in the final weeks of the year.
For the long-term, we’ve done quite well. Over the last 14 years, our Buy List has gained 309.61% while the S&P 500 has gained 247.13%.
Our biggest winner of the year was Moody’s (MCO) which gained nearly 70%. Fifteen of our 25 stocks were up more than 30%. Every stock except Cognizant Technology Solutions (CTSH) and Eagle Bank (EGBN) finished in the black.
For people who care about such things, the “beta” of our Buy List in 2019 was 0.8125. That’s pretty low for us. The correlation of the daily changes of the Buy List to the changes of the S&P 500 was 89.96%.
The chart below details the Buy List’s performance. I’ve listed each stock along with the number of shares and the starting and ending prices. For tracking purposes, I assume the Buy List is a $1 million portfolio that starts out equally divided among the 25 stocks.
Stock Shares 12/31/18 Beginning 12/31/19 Ending Profit/Loss AFL 877.96313 $45.56 $40,000.00 $52.90 $46,444.25 16.11% BDX 177.52530 $225.32 $40,000.00 $271.97 $48,281.56 20.70% BR 415.58442 $96.25 $40,000.00 $123.54 $51,341.30 28.35% CBPX 1571.70923 $25.45 $40,000.00 $36.43 $57,257.37 43.14% CERN 762.77651 $52.44 $40,000.00 $73.39 $55,980.17 39.95% CHD 608.27251 $65.76 $40,000.00 $70.34 $42,785.89 6.96% CHKP 389.67365 $102.65 $40,000.00 $110.96 $43,238.19 8.10% CTSH 630.11972 $63.48 $40,000.00 $62.02 $39,080.03 -2.30% DHR 387.89760 $103.12 $40,000.00 $153.48 $59,534.52 48.84% DIS 364.79708 $109.65 $40,000.00 $144.63 $52,760.60 31.90% EGBN 821.18661 $48.71 $40,000.00 $48.63 $39,934.30 -0.16% FDS 199.87008 $200.13 $40,000.00 $268.30 $53,625.14 34.06% FISV 544.29174 $73.49 $40,000.00 $115.63 $62,936.45 57.34% GL 536.69663 $74.53 $40,000.00 $105.25 $56,487.32 41.22% HRL 937.20712 $42.68 $40,000.00 $45.11 $42,277.41 5.69% HSY 373.20396 $107.18 $40,000.00 $146.98 $54,853.52 37.13% ICE 530.99695 $75.33 $40,000.00 $92.55 $49,143.77 22.86% MCO 285.63268 $140.04 $40,000.00 $237.41 $67,812.05 69.53% ROST 480.76923 $83.20 $40,000.00 $116.42 $55,971.15 39.93% RPM 680.50357 $58.78 $40,000.00 $76.76 $52,235.45 30.59% RTN 260.84121 $153.35 $40,000.00 $219.74 $57,317.25 43.29% SBNY 389.06721 $102.81 $40,000.00 $136.61 $53,150.47 32.88% SHW 101.66218 $393.46 $40,000.00 $583.54 $59,323.95 48.31% SJM 427.85325 $93.49 $40,000.00 $104.13 $44,552.36 11.38% SYK 255.18341 $156.75 $40,000.00 $209.94 $53,573.21 33.93% Total $1,000,000.00 $1,299,897.68 29.99% On August 8, 2019, Torchmark changed its name to Globe Life. The ticker symbol changed from TMK to GL.
Click here to see a detailed table of the dividend-adjusted results. I also have a list of all the stocks that have been on the Buy List over its 15-year history.
That’s all for now. RPM International (RPM) is due to report earnings on January 8. Wall Street expects earnings of 73 cents per share. The next issue of CWS Market Review will be on Friday, January 10. Be sure to keep checking the blog for daily updates. I’ll have more market analysis for you in the next issue of CWS Market Review!
– Eddy
Morning News: January 1, 2020
Posted by Eddy Elfenbein on January 1st, 2020 at 8:49 amTrump Says U.S.-China Trade Deal Will Be Signed on January 15
Google to End ‘Double Irish, Dutch Sandwich’ Tax Scheme
Airbus Beats Goal with 863 Jet Deliveries in 2019, Ousts Boeing from Top Spot
The Tech That Will Invade Our Lives in 2020
FDA Plans to Ban Most E-Cigarette Flavors But Menthol
A Simple Investment Strategy That Worked in 2019: Buy Almost Anything
China Moves to Steady Its Slowing Economic Growth
Florida, Trump’s New Home, Leads the U.S. in Money Migration
U.S. Stocks Rally to Cap Best Year Since 2013
Carlos Ghosn Has Tales to Tell and Scores to Settle
Nick Maggiulli: My Best Advice to Prospective Bloggers
The 2020 Buy List
Posted by Eddy Elfenbein on December 31st, 2019 at 10:40 pmHere are the 25 stocks for the 2020 Buy List. It’s locked and sealed, and I can’t make any changes for 12 months.
For tracking purposes, I assume the Buy List is a $1 million portfolio that’s equally divided among 25 stocks. Below are all 25 positions with the number of shares for each and the closing price for 2019. Whenever I discuss how the Buy List is doing, the list below is what I’m referring to.
Company Ticker Price Shares Balance AFLAC AFL $52.90 756.14367 $40,000.00 Ansys ANSS $257.41 155.39412 $40,000.00 Becton, Dickinson BDX $271.97 147.07505 $40,000.00 Broadridge Financial Solutions BR $123.54 323.78177 $40,000.00 Cerner CERN $73.39 545.03338 $40,000.00 Check Point Software CHKP $110.96 360.49027 $40,000.00 Church & Dwight CHD $70.34 568.66648 $40,000.00 Danaher DHR $153.48 260.62028 $40,000.00 Disney DIS $144.63 276.56779 $40,000.00 Eagle Bancorp EGBN $48.63 822.53753 $40,000.00 FactSet Research Systems FDS $268.30 149.08684 $40,000.00 Fiserv FISV $115.63 345.93099 $40,000.00 Globe Life GL $105.25 380.04751 $40,000.00 Hershey HSY $146.98 272.14587 $40,000.00 Hormel Foods HRL $45.11 886.72135 $40,000.00 Intercontinental Exchange ICE $92.55 432.19881 $40,000.00 Middleby MIDD $109.52 365.23009 $40,000.00 Moody’s MCO $237.41 168.48490 $40,000.00 Ross Stores ROST $116.42 343.58358 $40,000.00 RPM International RPM $76.76 521.10474 $40,000.00 Sherwin-Williams SHW $583.54 68.54714 $40,000.00 Silgan SLGN $31.08 1287.00129 $40,000.00 Stepan SCL $102.44 390.47247 $40,000.00 Stryker SYK $209.94 190.53063 $40,000.00 Trex TREX $89.88 445.03783 $40,000.00 Total $1,000,000.00 The five new stocks are Ansys (ANSS), Middleby (MIDD), Silgan (SLGN), Stepan (SCL) and Trex (TREX).
The five sells are Continental Building Products (CBPX), Cognizant Technology Solutions (CTSH), Raytheon (RTN), JM Smucker (SJM) and Signature Bank (SBNY).
Disney (DIS) is our largest stock, with a market cap of $261 billion. The Buy List is mostly large- and mid-cap stocks. Four of the five new buys for this year are our only stocks with market caps less than $10 billion. That’s not a strategic decision on my part. It just worked out that way.
Only AFLAC (AFL) and Fiserv (FISV) have been on the Buy List all 15 years. This is Stryker’s (SYK) 13th year.
Here’s a brief description (via Hoovers) of our five new stocks:
It’s good to look before you leap – and even before you make. That’s why ANSYS (ANSS) helps designers and engineers see how their ideas play out even before a prototype is built by simulating designs on a computer. The company’s software analyzes the models for their response to combinations of such physical variables as stress, pressure, impact, temperature, and velocity. Ranging from small consulting firms to multinational enterprises, its 40,000 customers come from a broad range of industries and include QualComm, Ford, TechnipFMC, Medtronic, and Speedo. Pennsylvania-based ANSYS generates about 60% of revenue from outside the US, with Japan and Germany among its leading international markets.
Founded in 1888, Middleby (MIDD) makes a slew of commercial and institutional foodservice equipment for restaurants, retailers, and hotels worldwide. Middleby operates through three segments: Commercial Foodservice Equipment, Food Processing Equipment, and Residential Kitchen Equipment. The largest, Foodservice, makes machines for most types of cooking and warming activities. Products are sold under about 50 blue chip brands – Anets, Blodgett, Southbend, and TurboChef, among them. Residential Kitchen makes ovens, refrigerators, dishwashers, microwaves, and other related products, and Food Processing makes cooking, mixing, slicing, and packaging machines. About two-thirds of sales come from the US and Canada.
Silgan Holdings (SLGN) is one of the leading makers of metal containers in the world, and in North America, it holds the #1 position in metal food containers. Its containers are used by customers such as Campbell’s Soup, Del Monte, and Nestlé to package soups, vegetables, meat, seafood, and pet food. Through its Silgan Dispensing Systems business, the company supplies highly engineered triggers, pumps, sprayers and dispensing closure solutions for health care, garden, home, and beauty and food products. Silgan also makes plastic containers used by personal care, pharmaceutical, and other companies. About 80% of its revenue comes from North America.
Stepan Company (SCL) makes basic and intermediate chemicals, including surfactants, specialty products, phthalic anhydride, and polyurethane polyols. Surfactants, the company’s largest business, are used in cleaning agents and consumer products like detergents, toothpastes, and cosmetics. Stepan’s surfactants also have commercial and industrial applications ranging from emulsifiers for agricultural insecticides to agents used in oil recovery. The company also makes phthalic anhydride and other polymers, in addition to specialty chemicals for food and pharmaceutical uses. The US is Stepan’s biggest market.
Trex Company (TREX) is all decked out with plenty of places to go. It’s the world’s largest maker of wood-alternative decking and railing products, which are used in the construction of residential and commercial decks, rails, and trims. Marketed under the Trex name, products resemble wood and have the workability of wood, but require less long-term maintenance. The Trex Wood-Polymer composite is made of waste wood fibers and reclaimed plastic. Trex serves professional installation contractors and do-it-yourselfers through about 90 wholesale distribution centers, which in turn sell to retailers including Home Depot and Lowe’s. Trex products are available in more than 5,500 locations, primarily in the US and Canada.
The 2019 Buy List
Posted by Eddy Elfenbein on December 31st, 2019 at 10:15 pmThe 2019 trading year is on the books! For 2019, the S&P 500 gained 28.88% while our Buy List gained 29.99%. Including dividends, the S&P 500 gained 31.49% while our Buy List gained 31.57%.
That’s right, we beat the market by eight basis points!
This was a close finish. By August, our Buy List had a 6% lead over the market, but much of that eroded away in the final weeks of the year.
For the long-term, we’ve done quite well. Over the last 14 years, our Buy List has gained 309.61% while the S&P 500 has gained 247.13%.
Our biggest winner of the year was Moody’s (MCO) which gained nearly 70%. Fifteen of our 25 stocks were up more than 30% for the year. Every stock except Cognizant Technology Solutions (CTSH) and Eagle Bank (EGBN) finished in the black.
For people who care about such things, the “beta” of our Buy List in 2019 was 0.8125. That’s pretty low for us. The correlation of the daily changes of the Buy List to the changes of the S&P 500 was 89.96%.
The chart below details the Buy List’s performance. I’ve listed each stock along with the number of shares and the starting and ending prices. For tracking purposes, I assume the Buy List is a $1 million portfolio that starts out equally divided among the 25 stocks.
Stock Shares 12/31/18 Beginning 12/31/19 Ending Profit/Loss AFL 877.96313 $45.56 $40,000.00 $52.90 $46,444.25 16.11% BDX 177.52530 $225.32 $40,000.00 $271.97 $48,281.56 20.70% BR 415.58442 $96.25 $40,000.00 $123.54 $51,341.30 28.35% CBPX 1571.70923 $25.45 $40,000.00 $36.43 $57,257.37 43.14% CERN 762.77651 $52.44 $40,000.00 $73.39 $55,980.17 39.95% CHD 608.27251 $65.76 $40,000.00 $70.34 $42,785.89 6.96% CHKP 389.67365 $102.65 $40,000.00 $110.96 $43,238.19 8.10% CTSH 630.11972 $63.48 $40,000.00 $62.02 $39,080.03 -2.30% DHR 387.89760 $103.12 $40,000.00 $153.48 $59,534.52 48.84% DIS 364.79708 $109.65 $40,000.00 $144.63 $52,760.60 31.90% EGBN 821.18661 $48.71 $40,000.00 $48.63 $39,934.30 -0.16% FDS 199.87008 $200.13 $40,000.00 $268.30 $53,625.14 34.06% FISV 544.29174 $73.49 $40,000.00 $115.63 $62,936.45 57.34% GL 536.69663 $74.53 $40,000.00 $105.25 $56,487.32 41.22% HRL 937.20712 $42.68 $40,000.00 $45.11 $42,277.41 5.69% HSY 373.20396 $107.18 $40,000.00 $146.98 $54,853.52 37.13% ICE 530.99695 $75.33 $40,000.00 $92.55 $49,143.77 22.86% MCO 285.63268 $140.04 $40,000.00 $237.41 $67,812.05 69.53% ROST 480.76923 $83.20 $40,000.00 $116.42 $55,971.15 39.93% RPM 680.50357 $58.78 $40,000.00 $76.76 $52,235.45 30.59% RTN 260.84121 $153.35 $40,000.00 $219.74 $57,317.25 43.29% SBNY 389.06721 $102.81 $40,000.00 $136.61 $53,150.47 32.88% SHW 101.66218 $393.46 $40,000.00 $583.54 $59,323.95 48.31% SJM 427.85325 $93.49 $40,000.00 $104.13 $44,552.36 11.38% SYK 255.18341 $156.75 $40,000.00 $209.94 $53,573.21 33.93% Total $1,000,000.00 $1,299,897.68 29.99% On August 8, 2019, Torchmark changed its name to Globe Life. The ticker symbol changed from TMK to GL.
Here’s how the Buy List performed throughout the year:
Here’s the data behind the dividend-adjusted returns. I’ve listed each stock’s beginning price, ending price and dividend-adjusted starting price.
 Eddy Elfenbein is a Washington, DC-based speaker, portfolio manager and editor of the blog Crossing Wall Street. His