-
CWS Market Review – April 6, 2018
Posted by Eddy Elfenbein on April 6th, 2018 at 7:08 am“Whenever people agree with me, I always feel I must be wrong.” – Oscar Wilde
On Monday, it finally happened. For the first time in 443 trading days, the S&P 500 closed below its 200-day moving average. Dun dun duuuun!
Actually, this is a big deal. The 200-DMA is one of those things I file under “Simple Ideas that Actually Work.” The concept isn’t that hard. The stock market is prone to momentum, and the 200-DMA is a simple way to gauge how the market is doing relative to its previous trends.
Over the long haul, the market does poorly when it’s beneath its 200-DMA. Let me be clear—I don’t favor jumping ship. In fact, I think this is actually a good time for us, and our strategy. More on that later. But it’s important to understand that this is a different market than the one we experienced over the last several months.
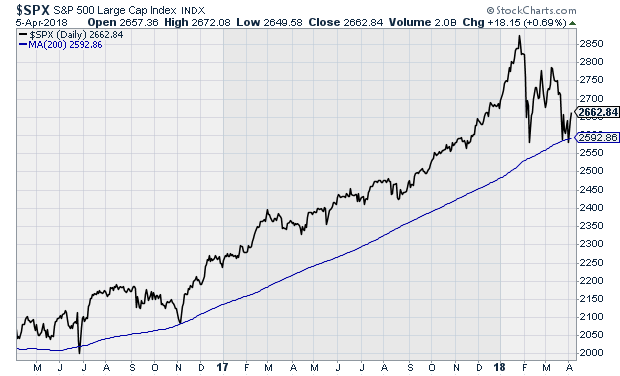
Here’s a good example. In the last two months, guess how many times the S&P 500 has fallen more than 2% in one day? I’ll give you a hint. Six. Now guess how many times it happened in 16 months prior to that? Another hint. Zero. Not one.
The market has become more volatile, more unpredictable and more unforgiving. In this week’s issue, I’ll discuss the good earnings report we got from RPM International. Also, Hormel Foods seems to be benefiting from the growing trade war. Who knew tariffs could impact pig prices? I’ll tell you what it all means. But first let’s look at why this is such a good market for stock pickers.
This Is a Good Market for Stock Pickers
One metric I like to keep track of is the relative performance of the Equally Weighted ETF (RSP) versus the S&P 500 ETF (SPY). The concept is pretty simple. The RSP is a fund that equally weights all the stocks in the S&P 500. The SPY is weighted by market value. The relationship between the two often tells us how “broad” the market is.
Over the last 16 months, the RSP badly lagged the SPY. In simple terms, the big fish have been doing most of the work while the minnows have been left behind. As a very general rule, stock pickers tend to like the minnows more than index funds or institutional investors. Whenever you hear that it was a bad year for active managers, in all likelihood, that’s a reflection of how broad the market was.
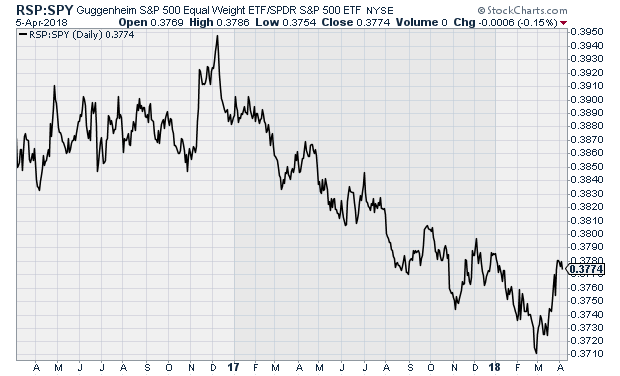
Some markets are broad and some are narrow. We had a very, very narrow one, but that changed abruptly in March. Now the RSP has been crushing the SPY. The big stars of the rally, like the FAANG stocks, have been feeling the pain. Facebook, for example, is more than 18% off its high. Tesla is down more than 21% from its high. The fractured market has been a good one for our Buy List, and I think this will continue. Many of the former high fliers are still overpriced. Also, a good portion of our Buy List stocks have been in unpopular sectors. It was tech that grabbed all the gains.
But the real test for stocks will be the first-quarter earnings season. Twenty of our 25 stocks will report earnings from mid-April to early May. Earnings season is the key time for every rational investor. I don’t have all the dates yet, but it looks like it will start for us around April 19, with Alliance Data Systems (ADS) and Danaher (DHR). Signature Bank (SBNY) usually reports about the same time, but they seem to enjoy waiting till the last minute to inform me.
I’m particularly looking forward to this earnings season. Analysts on Wall Street currently expect the S&P 500 to have earnings of 35.64. That’s the index-adjusted number, and it’s a very good one. (Every point in the index is worth about $8.5 billion.) If that estimate is right, then it would represent a 23.7% increase over last year’s Q1. That’s very strong growth, and the final number will probably be even better. Typically, about 60% to 75% of earnings reports exceed expectations. Indeed, on Wall Street, you’re expected to beat expectations.
Obviously, tax reform is playing a big role in the increased expectations. We’ve seen that in several of our stocks, but that’s not the only factor. The business climate is improving. Typically, Wall Street pares back its earnings estimates as earnings season approaches. Not this time. At the start of the year, analysts were expecting Q1 earnings of $33.97. Over the last four months, Wall Street’s estimate has increased by 5%.
For all of 2018, Wall Street expects the S&P 500 to earn 156.13. That’s up about 7% since the start of the year. The current estimate means the index is currently going for just over 17 times forward earnings. Valuation is a tricky game, but I’d call the current valuation elevated but not dangerous. Our stocks, however, are quite reasonably priced. Carriage Services (CSV), our funeral home operator, is going for less than 14 times earnings. ADS is going for less than 10 times earnings.
In particular, I’m also looking forward to the earnings report from Torchmark (TMK). They probably have the steadiest “earnings line” of any major stock on Wall Street. Their earnings seem to grow by a similar amount each quarter. Since late January, the shares are down about 9%. TMK is probably going for about 14 times this year’s earnings.
With this earnings season, I’m also on the lookout for increased guidance. Not all companies are required to provide guidance to investors. The better ones do, and I prefer to see it. The trick is spotting the ones that try to low-ball investors. Apple loves to do that, as does Ross Stores (ROST). This is still early in the year to see much in the way of higher or lower guidance. Still, companies are always talking with their suppliers and customers so they have a good sense of how the next few months will shake out.
Make sure your portfolio is well-diversified, and focus on high-quality stocks. Don’t try to catch a bottom in any of the falling stars of the bull market. The selling there isn’t over yet. I expect to see more volatility and more testing of the 200-DMA. The best defense in an environment like this is a solid portfolio of Buy List stocks. Now let’s look at the recent earnings beat from RPM International.
RPM International Beats Earnings
On Thursday, RPM International (RPM) reported fiscal Q3 earnings of 30 cents per share. That profit included a one-penny non-recurring gain due to the tax-reform act, plus another eight cents due to lower tax rates, so let’s call it 21 cents per share. Wall Street had been expecting 18 cents per share.
This is one of our quieter stocks, but don’t overlook it. RPM had a solid quarter. Net sales rose 7.8% to $1.1 billion. Quarterly EBIT (earnings before interest and taxes) rose 52%.
“RPM’s operating performance for the third quarter was outstanding, despite severe, continued industry-wide headwinds from higher raw-material costs. We continue to generate exceptional EBIT leverage, reflecting the early success of cost-savings initiatives we began implementing last year and rigorous SG&A spending discipline we have exercised throughout this year,” stated Frank C. Sullivan, RPM chairman and chief executive officer.
The company has three business segments. The largest is the industrial group. For Q3, they had revenue growth of 9.2% to $569 million. The consumer group was up 6.4% to $363 million. The specialty segment had revenue growth of 6.5% to $170 million.
For Q4, RPM expects consolidated revenue growth in the “mid-to-upper” single digits. The company is narrowing its full-year guidance from $3 to $3.10 per share to $3.05 to $3.10 per share. That means RPM is going for less than 16 times earnings.
RPM shares haven’t done much of anything lately, but the stock got a little boost after the earnings report. This is a good company going for a good valuation. I’m dropping my Buy Below on RPM down to $52 per share.
Buy List Updates
You may be familiar with the “Butterfly Effect,” the idea that a very tiny event, like a butterfly flapping its wings, can cause a hurricane at the other end of the world. I often think of that when we consider the second- and third-order effects of financial markets. For example, Hormel Foods (HRL) had a very strong day on Wednesday. At one point, it was almost up 7%. That’s a huge move for a company like HRL.
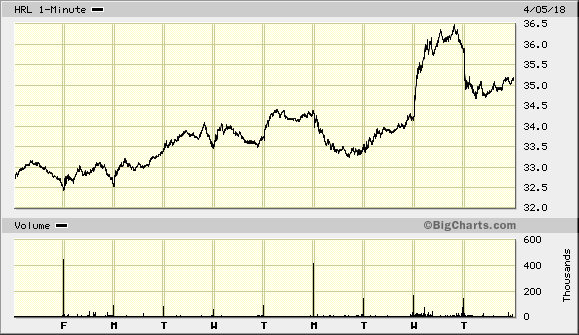
What happened? China decided to respond to the Trump administration’s tariffs on steel and aluminum by proposing tariffs on pork. That caused hog prices to plummet. This is important because rising commodity prices had been squeezing Hormel’s operating profits in recent quarters. In a matter of days, geopolitics bailed them out. Hormel looks quite good here. The company will report earnings again in later May.
This week, the New York Stock Exchange, which is owned by Intercontinental Exchange (ICE), reached a deal to buy the Chicago Stock Exchange (CHX). A few weeks ago, an investor group led by a Chinese conglomerate tried to buy the CHX. The SEC blocked the deal. The CHX used to be a big regional player, but it’s small potatoes nowadays. They didn’t disclose the numbers of the deal, but the WSJ said it was around $70 million. That’s barely a dent compared with ICE’s market cap of $42 billion. Still, it’s nice to see ICE expand.
Also, this week, JM Smucker (SJM) said they’re buying Ainsworth Pet Nutrition for $1.7 billion. They make the Nutrish dog treats which are endorsed by Rachel Ray.
Premium pet food is a fast-growing sector. Recently, General Mills snapped up Blue Buffalo for $8 billion. In my opinion, that was way too much. But unlike General Mills, Smucker already has a pet-food division (they have the Meow Mix brand). SJM claims this will help them cut overhead costs for Ainsworth. We’ll see.
The good news is that Smucker is getting a pretty good deal for Ainsworth. They’re paying 12 times EBITDA for it. Smucker also said they’re considering ditching their baking business which includes brands like Pillsbury. Interestingly, shares of SJM didn’t get slammed, which often happens to the acquirer when big deals are announced.
That’s all for now. Next week will be fairly quiet for economic news, but towards the end of the week, we’ll start seeing the first batch of Q1 earnings reports. Our Buy List earnings report won’t start until the week after that. There are a few things to keep an eye out for. On Wednesday, we’ll get the minutes from the most recent Fed meeting. Also on Wednesday is the latest CPI report. There have been some muted signs of greater inflation. Be sure to keep checking the blog for daily updates. I’ll have more market analysis for you in the next issue of CWS Market Review!
– Eddy
Syndication Partners
I’ve teamed up with Investors Alley to feature some of their content. I think they have really good stuff. Check it out!
Sell These 2 FAANG Stocks About to Be Destroyed
In what was a very poor April Fool’s joke, the stock market took a tumble on Monday, closing below its 200-day moving average for the first time since June 2016. U.S. stocks had their worst start to an April in many decades as measured by the S&P index. The 2.2% plunge was exceeded by only the 2.5% dive in 1929 when the index only consisted of 90 stocks. This drop followed the worst three month period for global stocks in more than two years.
This selloff was once again led by technology stocks – the Nasdaq 100 index lost 2.9% – as more reasons to sell tech outweighed expected stellar earnings reports (average gains of 22%) later this month. The so-called FAANG stocks extended their recent fall. On Monday, they lost $78.7 billion in market value, bringing the total decline in value to $397 billion just from March 12
The reasons behind the tech selloff were many and included: the continuing worries over regulation of social media, thanks to Facebook; a stupid April Fool tweet from Tesla’s Elon Musk joking about bankruptcy; tweets from President Trump continuing his rants about Amazon; further tweets from the President threatening the future of NAFTA, reigniting the market’s worries about a global trade war; and finally a report that Apple may use chips of its own design in Macs rather than Intel’s chips.
Hopefully, the political worries coming from the White House will eventually fade: if so, then that means the main long-term worry surrounds the social media stocks and in particular, Facebook.
Warren Buffett Loves the Industry of this Beaten Down High-Yield Stock. You Should Too.
Last year at the Berkshire Hathaway annual shareholder meeting, billionaire Warren Buffett stated: “We have got a big appetite for wind or solar.” This high-yield stock is a pure play wind and solar energy producer that was just upgraded by Goldman Sachs. View the recent share price decline as an opportunity to invest in the renewable energy sector at a great buy-in price.
Pattern Energy Group (Nasdaq: PEGI) is an owner/operator of 20 wind power facilities, including one project it has agreed to acquire, with a total owned interest of 2,736 MW in the United States, Canada and Chile. Each power facility is contracted to sell all its energy output, or a majority, on a long-term, fixed-price power sale agreement. Ninety-two percent of the electricity to be generated by the facilities will be sold under these power sale agreements, which have a weighted average remaining contract life of approximately 14 years.
The company has been focused on growing its portfolio since the 2013 IPO. At that time the company owned 1,041 MW of energy production capacity. The added and future acquisitions for Pattern Energy Group are sourced and developed by a related private investment company called Pattern Development. Pattern Development is more like an investment fund that searches out renewable energy production projects to fund. Management has a stated goal of reaching 5,000 MW of owned capacity by 2020. At this time the company already has over 1,000 MW of new projects where PEGI has the right of first offer to purchase the projects when they are ready to come on line. In its long-term development pipeline, management claims visibility on up to 10,000 MW.
Investors have participated in the growth, with the PEGI dividend increasing every quarter until the most recent announcement. From 2014 through the end of 2017 the dividend grew by 35%. On March 1, 2018 the company chose for the first time to not increase the dividend. It was kept level with the previous rate. While the market did not like the lack of dividend increase, it was a prudent move by the Board of Directors to not announce an increase. Cash flow from recent acquisitions had not kicked in to boost free cash flow to pay a higher dividend. In February the company announced the purchase of a 206 MW portfolio of wind and solar projects in Japan. The portfolio has three operating facilities and two under construction. It is an almost certainty that PEGI will soon resume dividend growth.
The PEGI share price peaked above $24 in September 2017. The shares now trade at $17 and change with a 9.75% current yield. This is a dividend growth stock, in the growing renewable energy sector. The current sell-off of the stock is not justified by fundamentals. When the dividend again starts to grow this stock could be bid up again into the mid-$20’s.
-
Morning News: April 6, 2018
Posted by Eddy Elfenbein on April 6th, 2018 at 7:03 amBright Lights, Big Shoulder Pads: A Timid Japan Recalls Its Bubble Era
China Has the Cards to Call Trump’s Bluff
White House Tries to Pull NAFTA Back From Brink as Deadlines Loom
Trump’s Criticism of Amazon: It’s Personal
Facebook Retracted Zuckerberg’s Messages From Recipients’ Inboxes
Corporate America Will Bring Next Wave of Pain, Money Managers Warn
Dimon’s Take on Taxes, Health Care, the Fed
Samsung Profit Climbs to Record on Strong Memory-Chip Demand
Coinbase COO Says Exchange Will Launch Venture-Capital Arm for Digital-Currency Projects
Target to Pay $3.7 Million in Settlement Over Job-Screening Policies
Delta Says Hack on Vendor Exposed Customer Credit-Card Data
Hidden by Model 3 Mess, Tesla’s Other Problem Is About to Emerge
Jeff Miller: Are You A Contrarian Trend Follower?
Roger Nusbaum: Don’t Let Big Tech Ruin You
Be sure to follow me on Twitter.
-
Morning News: April 5, 2018
Posted by Eddy Elfenbein on April 5th, 2018 at 7:03 amSoutheast Asia Braces for Trade War by Bolstering Growth
China’s Rapid Response to Tariffs Raises Treasuries Risk, for Some
China Targets Detroit, Hits Tesla and BMW Instead
Crash Course in Market Timing Shows Cost of Being Wrong at Tops
Facebook Says Data Leak Hits 87 Million Users, Widening Privacy Scandal
Sears Holding, Delta Air Hit by Customer Data Breach at Tech Firm
JPMorgan Chief James Dimon Likes the Bank’s Growth Prospects, Despite Risks
AMC Set to Open First Movie Theater in Saudi Arabia
Netflix: Why It’s ‘Virtually Impossible’ to Call It a ‘Buy’
Why Google, IBM & Microsoft Are All Expanding In Taiwan This Year
Spotify Shares Attract All Ages, Not Just Millennials
YouTube Attacker’s Complaints Echoed Fight Over Ad Dollars
Michael Batnick: The Limits to Data
Cullen Roche: Wisdom on Real Returns
Be sure to follow me on Twitter.
-
Morning News: April 4, 2018
Posted by Eddy Elfenbein on April 4th, 2018 at 8:04 amChina Fires Back at Trump With the Threat of Tariffs on 106 U.S. Products, Including Soybeans
U.S. Stock and Crop Futures Tank After China Announces Reciprocal Tariffs
New York Fed Taps John Williams to Be Next President
In His Amazon Tiff, Trump Bullies the Big Kid
Amazon May Rival Walmart Effort for Flipkart Control, Mint Says
Spotify Hasn’t Yet Justified a $30 Billion Valuation
Tesla at Risk From China Tariffs, Adding to Musk’s Woes
Supersonic Jet With Less Noise? Lockheed Wins NASA Award to Try
China’s Anbang Insurance Gets $9.7 Billion Capital Injection From Rescue Fund
The Bank of Japan Steps Up With Record Buys of Local Stocks
BS and Viacom Shouldn’t Let Egos Short-Circuit a Merger
Joshua Brown: The Best Hedge There Is
Roger Nusbaum: Did The SPX Just Dodge A Bullet?
Lawrence Hamtil: Understanding Dividends
Be sure to follow me on Twitter.
-
Morning News: April 3, 2018
Posted by Eddy Elfenbein on April 3rd, 2018 at 7:05 amChina Finds California Wine Pairs Well With a Trade War
Acting Chief Recommends Reining In Consumer Financial Protection Bureau
How Washington Is Undermining the Stock Market’s Highest-Flying Sector
Murdoch’s Fox Could Sell Sky News to Disney to Appease UK Regulator
Why Spotify Doesn’t Want a Stock Pop on Its First Day of Trading
Facebook Data Scandal Has Left Zuckerberg Isolated in Tech
Sinclair Videos Renew Debate Over Video Ownership
GM Throws Wrench in U.S. Auto Sales by Deserting Monthly Reports
Musk Needs to Recharge Tesla’s Finances to Make the Model 3 Go
Toshiba Won’t Cancel $18 Billion Chip Deal Unless Any Major Material Change
2 Founders of $32 Million Centra Virtual Currency Project Are Arrested
Howard Lindzon: Momentum Monday – Where There is Volatilty There is Opportunity
Ben Carlson: How to Build Trust
Be sure to follow me on Twitter.
-
The Streak Is Over
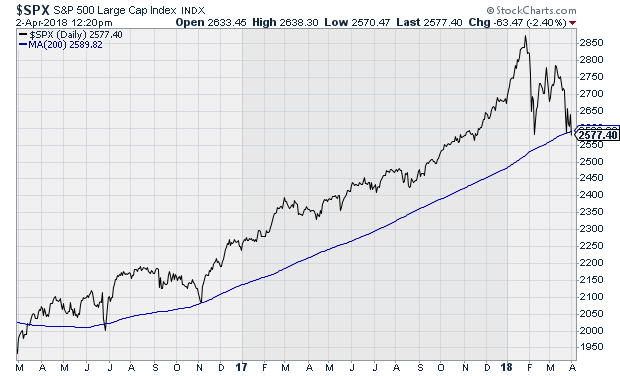
Posted by Eddy Elfenbein on April 2nd, 2018 at 4:09 pmThe S&P 500 closed today at 2,581.88. This is the first time in 21 months that the index has closed below its 200-day moving average.
The S&P 500 also closed barely above the low close from February 8 which was 2,581.00. We came within one point of that.
The index is now more than 10% below the high close from January 26. That’s the official mark of a correction. We had been there before, but now we’re back.
-
The 200-DMA Streak May End Today
Posted by Eddy Elfenbein on April 2nd, 2018 at 12:23 pmThe S&P 500 is currently below its 200-day moving average.
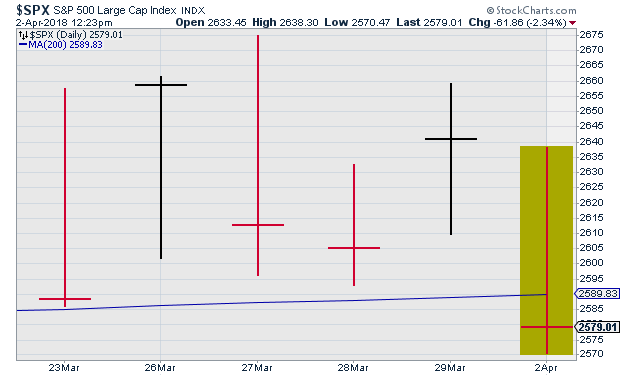
We closed below it on June 27, 2016, but that was for one day. Before that, we have to go back to March 15, 2016. In other words, the S&P 500 has traded above its 200-DMA almost continuously for two years.
-
China Strikes Back
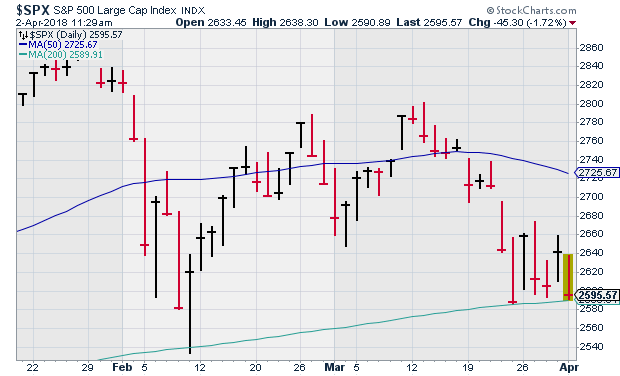
Posted by Eddy Elfenbein on April 2nd, 2018 at 11:25 amThe stock market is down about 1.8% this morning as fears of a trade war continue to escalate. The Chinese Finance Ministry said they’re going to place tariffs on several U.S. products.
The ISM Manufacturing report for March came in at 59.3. That’s pretty good. The prices paid report was 78.1 which is a seven-year high. Also, construction spending rose 0.1% for February. That’s pretty weak.
Shares of Tesla fell as low as $244.59 this morning. That’s a 52-week low. The stock is about 6% below its high from March 2014. A lot of people rode this one on the way up.
Looking at the broad market, once again, the S&P 500 is testing its 200-day moving average.
-
Morning News: April 2, 2018
Posted by Eddy Elfenbein on April 2nd, 2018 at 7:03 amChina Urges More Trade Talks as Tariffs on U.S. Goods Begin
Japanese Businesses Plan More Investment Even as Sentiment Slips
Bahrain’s Biggest Oil Find Since 1932 Dwarfs Reserves
U.S. Futures Point to Fall Amid Trade Worries
NTSB ‘Unhappy’ With Tesla Over Crash Disclosures
Cloudflare Announces a Faster, More Private Internet Directory
Alibaba Bets Big On Local Delivery in a $9.5 Billion Deal
Silicon Valley Rivals Take Shots at Facebook
Mall Vacancies Reach Six-Year High as Retail Slump Batters Local Economies
Retailers Race Against Amazon to Automate Stores
Joshua Brown: Wait – Did I Call the Top in Bitcoin?
Jeff Miller: Weighing the Week Ahead: Have Stock Prices Veered from the Fundamentals?
Cullen Roche: 2 Thoughtful Concerns on the US National Debt
Be sure to follow me on Twitter.
-
CWS Market Review – March 31, 2018
Posted by Eddy Elfenbein on March 31st, 2018 at 11:50 am“It was never my thinking that made the big money. It was always my sitting.”
– Jesse LivermoreThe first quarter of 2018 is officially on the books. Sadly, this was the worst quarter for the S&P 500 since the third quarter of 2015, and it was the second-worst quarter for the index in the past 22 quarters.
Those stats, however, are a bit misleading. While this was a down quarter for the S&P 500, the index only fell 1.22%; many of those 22 quarters were positive, but only barely. I point this out because this was all part of the “Baby Step” rally that defined the market for the past few years.
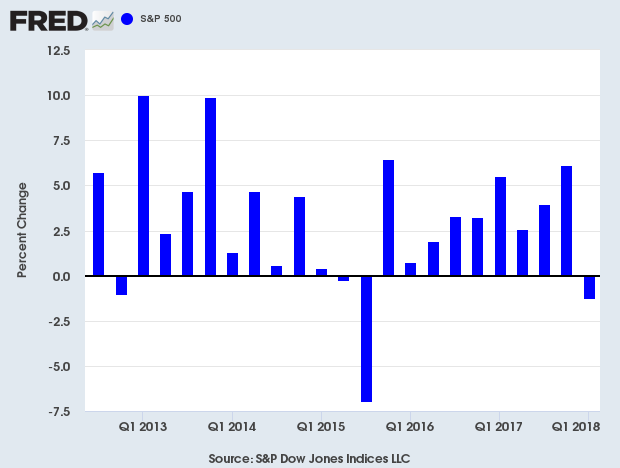
That rally came to an end during Q1. In this issue of CWS Market Review, I’ll explain what it all means. I’ll also highlight the recent earnings report from FactSet. The financial data folks beat earnings and raised guidance, yet the stock fell. Frustrating, but not unusual. I’ll have more on that in a bit. I’ll also preview next week’s earnings report from RPM International. But first, let’s look at the market’s Jekyll and Hyde first quarter.
The Jekyll-and-Hyde Stock Market
I think it’s best to divide Q1 into two segments. The first part started on New Year’s and ended on January 26. This was the last stage of the “Baby Step” rally. The market seemed to go up every day, but only by a little bit. On those occasions when the market fell, it was also by a little bit.
Daily volatility was very low, and the indexes never strayed far from their 52-week highs. The S&P 500 went an amazing 404 days without closing more than 5% below its all-time high. In particular, the market’s gains were driven by a small group of very large tech stocks. This became known on Wall Street as the FAANG stocks (Facebook, Amazon, Apple, Netflix and Google).
The problem was that the big gains from these few stocks made it so most stock-pickers trailed the S&P 500. The only exception was if stock-pickers owned one or more of the FAANGs, but most of them appeared wildly overpriced. Still, they climbed higher and higher. By January 26, the S&P 500 had gained 7.4% for the year.
After that, things began to change. On Monday, January 29, the S&P 500 fell 0.67%. That’s really not much, but it was the worst day for the market in five months. As I said, that fact said a lot more about the preceding five months than it did about what happened on January 29. The next day, the S&P 500 fell by more than 1%. Now traders started to take notice. On Friday, the index fell more than 2%. The next day, it fell another 4%. The rout was on.
On Monday, February 8, the S&P 500 closed at 2,581. That was a 10.2% drop from the all-time-high close just nine days before. After that, the market quickly rebounded, but I warned you that the storm had not yet passed. Here’s a sample of what I wrote:
February 16, “But mark my words–the bears will be back.”
February 23, “I think there’s a good chance we will soon see more dips.”
March 16, “I still think there’s danger out there.”The reason I was suspicious of the market’s rebound is that the index “tested” its 200-day moving average and quickly reversed course. On February 9, the S&P 500 dipped its toe below the 200-DMA, but it closed higher on the day. The index rallied for another five days in a row. A quick bounce like that off the 200-DMA is not a good sign.
Sure enough, the stock market stalled out again after March 9. The S&P 500 then fell eight times in ten days. It wasn’t helped by trade-war talk from the president. Then last Friday, March 23, the S&P 500 again slipped below its 200-DMA but closed just above it. Old Wall Street wisdom tells us that the more a support level is tested, the greater the chance is that it will fail.
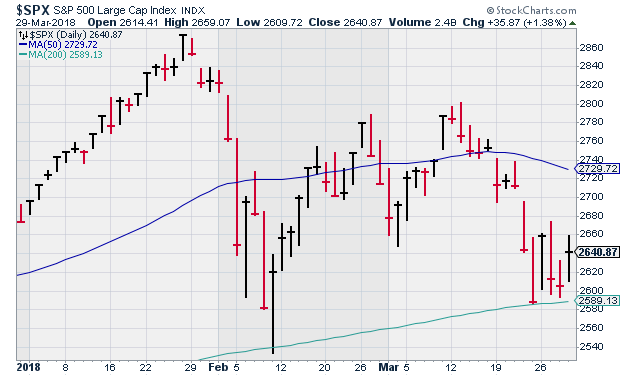
Like a slingshot, the market shot up on Monday. The Dow gained 669 points for its best point day in nearly a decade and its third-best point day ever. Yet again, the market lost steam later in the week. What’s important to understand is that the period since January 26 has been the time of the “broken market.” Sure, stock prices have gotten pushed around, but most of the damage has fallen on the well-known FAANG stocks.
The broken market, however, has been quite good for the Buy List in a relative sense. Since the last stage of the bull market was so heavily focused on FAANG and some other areas, our Buy List has trailed the market. But since the market fractured, we’ve done much better. By that, of course, I mean that we’ve fallen much less than everybody else has.
In fact, as of the close of trading on Thursday, our Buy List holds a slight lead over the S&P 500, -1.03% to -1.22%. (Note that that doesn’t include dividends.) Seven weeks ago, we were trailing the S&P 500 by more than 2.5%. We’ve made all that up, and then some.
The difference this time is that the market faces more serious challenges. Inflation may be creeping higher and the Fed is determined to raise interest rates. The labor market looks pretty good. This week, we learned that initial jobless claims fell to their lowest point in 45 years. A key indicator I like to watch is the spread between the 2- and 10-year Treasuries. On Thursday, the spread stood at 45 basis points. That’s the lowest spread since 2007. Four years ago, the spread was over 220 basis points. It’s not negative yet, but the 2/10 has gone negative before the last four recessions.
I don’t want anyone to panic. If you’re overpriced in tech stocks, then you may have something to worry about, but we’re not. Most of the FAANGs have been feeling the hurt lately. Facebook, for example, plunged 18% in seven days. Shares of Amazon got dinged by a presidential tweet. On the other side of the market, a lot of boring Consumer Staples names have been doing well. Hormel Foods (HRL) was up nearly 6% in March. Church & Dwight (CHD) was a winner as well. After lagging in January, our high-quality strategy is paying off in a difficult market. Now let’s look at this week’s earnings report from FactSet.
FactSet Beat and Raised Guidance
On Tuesday morning, FactSet (FDS) reported fiscal Q2 earnings of $2.12 per share. That’s a healthy 17.1% increase over last year’s Q2. The consensus on Wall Street was for $2.06 per share. In last week’s CWS Market Review, I said I was looking for something between $2.08 and $2.11 per share, so FDS beat even optimistic forecasts.
Digging into the numbers, organic revenues increased 5.7% to $310.4 million. A key metric I watch is their adjusted operating margin. That fell from 33.1% in last year’s Q2 to 31.4% for this year. The company blamed negative foreign exchange. On the plus side, free cash flow rose more than 20% to $86.1 million.
An important metric for FactSet is what the company calls “Annual Subscription Value” or ASV. At the end of Q2, that stood at $1.35 billion. Their “organic” ASV rose by 5.8%. Frankly, that could be higher. Like many companies, FDS was greatly helped by a lower tax rate. The company also approved adding $300 million to its current share-buyback program.
FactSet stopped providing quarterly guidance, but they still give guidance for the full year. The company raised its 2018 guidance range for this by 10 cents at both ends. They now see full-year adjusted EPS between $8.35 and $8.55 per share. That’s pretty good.
After the earnings report, the stock pulled back and finished the quarter at $199.42 per share. I’m encouraged by the earnings report. This week, I’m lifting our Buy Below price on FactSet to $207.
Earnings Preview for RPM International
RPM International (RPM) is due to report fiscal Q3 earnings on Thursday, April 5. In January, RPM reported fiscal Q2 earnings of 70 cents per share which beat the Street by eleven cents. However, that included a tax benefit of nine cents per share. Quarterly sales rose 10.5%. Organic sales rose by 4.3%, and acquisition sales were up 4.7%. Forex added another 1.6% to sales growth.
RPM is one of our quieter stocks, and that is just fine by me. For Q2, RPM’s EBIT rose by 15.4%. The company has three business segments. Last quarter, its industrial unit had sales growth of 11%, the consumer unit was up 11.1% and the specialty segment was up 7.4%.
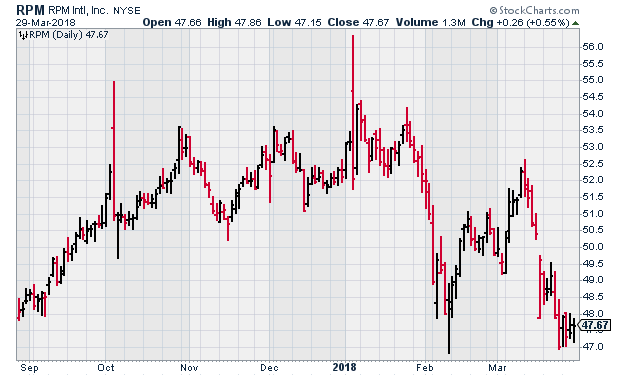
RPM said that the new corporate tax rate will add ten cents per share to its bottom line. For the entire fiscal year, RPM expects earnings of $3 to $3.10 per share. They’ve already made $1.56 per share for the first half of fiscal 2018. For Q3, Wall Street expects 18 cents per share.
Before I go, I want to address the recent drop in Alliance Data Systems (ADS). The stock had been falling, and it fell even more this week. On Thursday, the shares got to their lowest point since the election. Off Wall Street called the stock a short. I think some investors are worried that ADS will soon cut their guidance.
There’s also the fear that Facebook’s limiting the information they share with data brokers would negatively impact ADS. The company defended itself. On Thursday, ADS reiterated guidance and said they don’t have a close relationship with any social media platforms. ADS will report earnings again on April 19.
That’s all for now. Next week, we’ll get some key economic reports. On Monday, the ISM Manufacturing report comes out. The recent numbers here have been quite good. On Wednesday, the ADP payroll report is released. Then Friday is Jobs Day. We’ll get the employment report for March. The last NFP report showed an increase of 313,000 jobs. Be sure to keep checking the blog for daily updates. I’ll have more market analysis for you in the next issue of CWS Market Review!
– Eddy
-
Archives
- July 2026
- June 2026
- May 2026
- April 2026
- March 2026
- February 2026
- January 2026
- December 2025
- November 2025
- October 2025
- September 2025
- August 2025
- July 2025
- June 2025
- May 2025
- April 2025
- March 2025
- February 2025
- January 2025
- December 2024
- November 2024
- October 2024
- September 2024
- August 2024
- July 2024
- June 2024
- May 2024
- April 2024
- March 2024
- February 2024
- January 2024
- December 2023
- November 2023
- October 2023
- September 2023
- August 2023
- July 2023
- June 2023
- May 2023
- April 2023
- March 2023
- February 2023
- January 2023
- December 2022
- November 2022
- October 2022
- September 2022
- August 2022
- July 2022
- June 2022
- May 2022
- April 2022
- March 2022
- February 2022
- January 2022
- December 2021
- November 2021
- October 2021
- September 2021
- August 2021
- July 2021
- June 2021
- May 2021
- April 2021
- March 2021
- February 2021
- January 2021
- December 2020
- November 2020
- October 2020
- September 2020
- August 2020
- July 2020
- June 2020
- May 2020
- April 2020
- March 2020
- February 2020
- January 2020
- December 2019
- November 2019
- October 2019
- September 2019
- August 2019
- July 2019
- June 2019
- May 2019
- April 2019
- March 2019
- February 2019
- January 2019
- December 2018
- November 2018
- October 2018
- September 2018
- August 2018
- July 2018
- June 2018
- May 2018
- April 2018
- March 2018
- February 2018
- January 2018
- December 2017
- November 2017
- October 2017
- September 2017
- August 2017
- July 2017
- June 2017
- May 2017
- April 2017
- March 2017
- February 2017
- January 2017
- December 2016
- November 2016
- October 2016
- September 2016
- August 2016
- July 2016
- June 2016
- May 2016
- April 2016
- March 2016
- February 2016
- January 2016
- December 2015
- November 2015
- October 2015
- September 2015
- August 2015
- July 2015
- June 2015
- May 2015
- April 2015
- March 2015
- February 2015
- January 2015
- December 2014
- November 2014
- October 2014
- September 2014
- August 2014
- July 2014
- June 2014
- May 2014
- April 2014
- March 2014
- February 2014
- January 2014
- December 2013
- November 2013
- October 2013
- September 2013
- August 2013
- July 2013
- June 2013
- May 2013
- April 2013
- March 2013
- February 2013
- January 2013
- December 2012
- November 2012
- October 2012
- September 2012
- August 2012
- July 2012
- June 2012
- May 2012
- April 2012
- March 2012
- February 2012
- January 2012
- December 2011
- November 2011
- October 2011
- September 2011
- August 2011
- July 2011
- June 2011
- May 2011
- April 2011
- March 2011
- February 2011
- January 2011
- December 2010
- November 2010
- October 2010
- September 2010
- August 2010
- July 2010
- June 2010
- May 2010
- April 2010
- March 2010
- February 2010
- January 2010
- December 2009
- November 2009
- October 2009
- September 2009
- August 2009
- July 2009
- June 2009
- May 2009
- April 2009
- March 2009
- February 2009
- January 2009
- December 2008
- November 2008
- October 2008
- September 2008
- August 2008
- July 2008
- June 2008
- May 2008
- April 2008
- March 2008
- February 2008
- January 2008
- December 2007
- November 2007
- October 2007
- September 2007
- August 2007
- July 2007
- June 2007
- May 2007
- April 2007
- March 2007
- February 2007
- January 2007
- December 2006
- November 2006
- October 2006
- September 2006
- August 2006
- July 2006
- June 2006
- May 2006
- April 2006
- March 2006
- February 2006
- January 2006
- December 2005
- November 2005
- October 2005
- September 2005
- August 2005
- July 2005
 Eddy Elfenbein is a Washington, DC-based speaker, portfolio manager and editor of the blog Crossing Wall Street. His