-
Morning News: September 12, 2016
Posted by Eddy Elfenbein on September 12th, 2016 at 7:09 amFed Rate Hike Jitters and Clinton Concerns Hit Stocks Hard
OPEC Flips Forecast to Predict Rebound in Rival Supply Next Year
There’s a Simple Reason JPMorgan Is Warning Investors to Take Care With U.S. Treasuries
Want to Know How Trump’s Doing? Just Look at Mexico’s Peso
Hanjin Ship Unloads in U.S. as Fresh Funds Pledged
Ireland Doesn’t Want Apple’s Back Taxes, but the Irish Aren’t So Sure
HP Inc. to Buy Samsung’s Printing Business For Over a Billion Dollars
Canadian Fertilizer Giants Agrium and Potash Agree to Merge
Linde, Praxair End $60 Billion Merger Talks
Are Pop-Up Stores a Good Idea For Amazon?
Perry, Paulson and Och-Ziff Stung by Outflows Hitting Big Funds
No Driver? Bring It On. How Pittsburgh Became Uber’s Testing Ground
After Buying SABMiller, AB InBev Could See More Deals
Jeff Miller: Should We Fear the Fed?
Howard Lindzon: America’s In Turmoil and the Markets Just Agreed
Be sure to follow me on Twitter.
-
Finally, Some Volatility
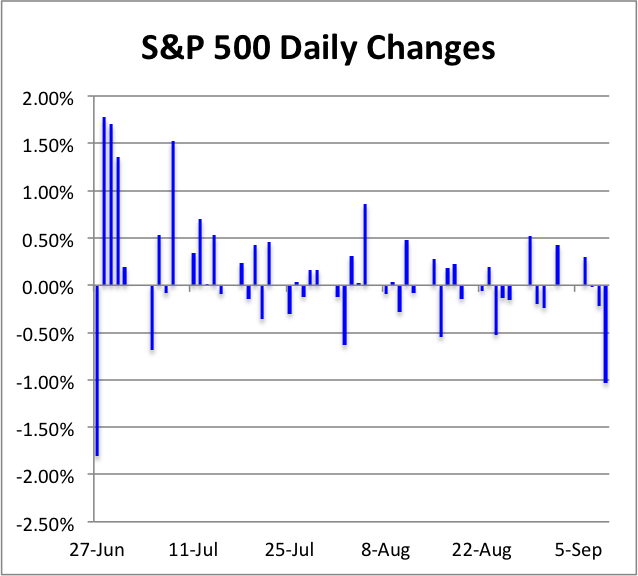
Posted by Eddy Elfenbein on September 9th, 2016 at 10:38 amThe S&P 500 is currently down over 1%. That’s something that hasn’t happened in a long time.
-
CWS Market Review – September 9, 2016
Posted by Eddy Elfenbein on September 9th, 2016 at 7:08 am“Risk comes from not knowing what you’re doing.” – Warren Buffett
Labor Day has traditionally marked a key turning point for Wall Street. This is when traders return to their desks from the Hamptons or Martha’s Vineyard. Typically, trading volume picks up, and historically, the stock market has been pretty sluggish during the seven weeks following Labor Day.
Still, I doubt we’re in for a rough stretch this year. The market’s volatility is very low, and the stocks are still somewhat aimless. Remarkably, the S&P 500 hasn’t strung together a three-day winning or losing streak in more than two months. Over the last 40 days, the S&P 500 has traded in a range of just 1.75%. That’s the tightest 40-day range on record.
The only trend is a lack of a trend.
In this week’s CWS Market Review, we’ll take a closer look at where the U.S. economy stands at the moment. Fortunately, things are gradually getting better. I don’t want to overstate the “sunny day” case because there are still a lot of weak spots out there.
The improving economy hasn’t escaped notice of our friends at the Federal Reserve. There’s now a growing consensus that the Fed will soon raise interest rates. The central bank gets together again on September 20-21. My take: The Fed will take a pass on a rate increase at that meeting, but the Fed members will also update their (notoriously poor) economic projections. This will give us a lot of clues as to the Fed’s mindset. I think there’s a decent chance that a December rate hike is in the works.
Later on, I’ll update you on some important news impacting our Buy List stocks. I’ll also tell you which Buy List stocks look particularly good right now. But first, let’s look at the August jobs report.
The Economy Is Improving—Gradually
Last Friday, the government said that the U.S. economy created 151,000 net new jobs last month. That was a bit below Wall Street’s estimate of 180,000. Even though the jobs report missed expectations, the figure is still basically within the trend of the last few years. There’s nothing really surprising here. For the third month in a row, the unemployment rate held steady at 4.9%.
The big takeaway is that the economy is slowly improving. Sure, it’s certainly not great. But it’s getting better. With each jobs report, I’ve been keeping a close eye on wages. The good news is that Americans are finally getting a pay raise. It’s been years since we could say that.
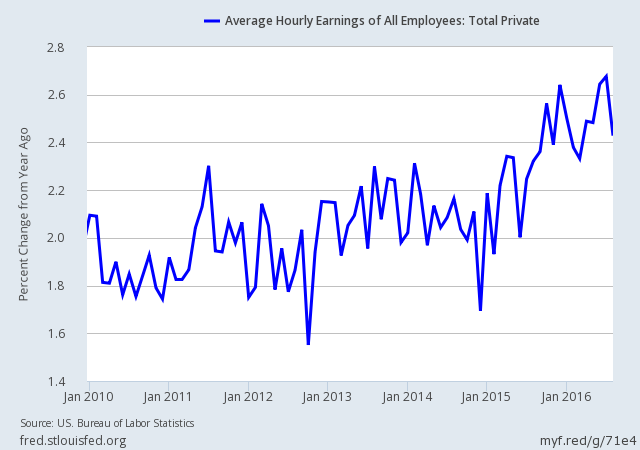
Over the last year, average hourly earnings increased by 2.4%. Considering where the economy had been, that’s not bad. Importantly, it’s more than the rate of inflation. You can be sure that Janet Yellen and her friends at the Fed are watching this figure, because any hint that we’re at full employment (meaning employers have to pay more to get workers) will spur the Fed to action. For years, the safe bet was to assume that the Fed wouldn’t do anything. That’s no longer the case.
I prefer to ignore the talking heads and listen to the one opinion that truly matters—the bond market’s. Here we can also see that the bond market is waking up to the reality of a Fed rate hike.
The key to watch is the two-year yield. Two months ago, the two-year was yielding just 0.56%. Now it’s up to 0.78%. One of my favorite economic indicators, the spread between the 2- and 10-year Treasuries, recently dropped below 80 basis points for the first time in nearly nine years. Don’t worry. We’re still a long way from the danger zone. The Fed will have to raise rates a few more times before a recession is near.
The Consumer Is Pulling the Economy Along
Last week, the Commerce Department reported that personal spending rose 0.3% in July. Also, the figure for June was revised upward to an increase of 0.5%. This is good news for the economy, and it suggests that the encouraging trend for consumer spending we saw in Q2 is still going. The Q2 GDP report showed consumer spending rising at an annualized rate of 4.4%. That’s the fastest pace in two years.
What about Q3? We’re already three-fourths done with the quarter, and things are looking good. The Atlanta Fed’s GDPNow currently estimates the economy grew by 3.5% in Q3. We’ll get our first look at the GDP data at the end of next month. But before that happens, we’ll get a look at Q3 earnings reports. According to S&P, the third-quarter earnings season looks to snap the S&P 500’s seven-quarter streak of falling profits. For Q2, operating earnings for the S&P 500 fell by 1.2%, and that was the best quarter of the last seven.
Analysts currently expect the S&P 500 to earn $29.61 for Q3 (that’s the index-adjusted number). That would be an all-time high, and it would be an increase of 16.4% over last year’s Q3. The earnings outlook will be helped by an expected 34% increase in healthcare profits and a 16% increase in profits for tech stocks. Right now, the S&P 500 is going for 16.4 times next year’s earnings which is slightly rich, but not too worrying.
I’m also pleased to see that companies are finally reducing their cash piles. Let me rephrase that. Companies are finally reducing their gigantic, stupendous cash mountains. Until now, companies were perfectly happy to let that money grow or spend some on dividends and share buybacks. Now they’re putting their money to use by growing their businesses. That’s a very good sign.
Buy List Bargains
In recent issues of CWS Market Review, I’ve discussed how the market has become increasingly friendly towards riskier assets. You can see this phenomenon happening across several markets. Junk-bond spreads, for example, are much tighter than they were six months ago.
This is simply the natural outcome of low volatility. Investors are climbing up the risk ladder in search of bigger gains. We can certainly see this in the Tech Sector (XLK), which has done quite well lately. In fact, the Nasdaq Composite just touched a new high, even though other indexes are still below their highs. We’ve also seen that High-Beta stocks (SPHB) have been stellar performers this year.
Tied to this trend is the improvement in economically cyclical stocks. The Energy Sector (XLE) continues to be popular this year. Of course, that comes after a few years of very poor performance.
At the other end of the risk spectrum, defensive sectors like Consumer Staples (XLP) have lagged the market for much of this year. I want to make it clear to investors that a shift in risk appetite for the overall market isn’t entirely friendly to our strategy of focusing on high-quality stocks. This doesn’t pose any danger for us. In fact, the real danger is for the folks madly chasing risky returns. But it will require us to be extra diligent with our strategy.
While I consider any Buy List stock that’s currently below its Buy Below price to be a buy, I wanted to highlight a few stocks that look particularly good at the moment.
Alliance Data Systems (ADS) had a very painful end to last year. In a few weeks, the shares fell from over $300 to under $180. For much of the last six months, ADS bounced between $200 and $220 per share. I think it could be poised for a breakout. The company beat earnings for Q2, and its full-year guidance was above expectations. ADS is a particularly good buy below $215 per share.
Microsoft (MSFT) is inching closer to its all-time high from 1999. The company had an outstanding earnings report in July, and their cloud business is doing quite well. I think we can expect a dividend increase soon from the software giant. MSFT currently yields 2.5%.
Shares of Cerner (CERN) popped after the last earnings report, but the stock has barely moved in the past two weeks. It will wake up again at some point. By the way, the Kansas City Business Journal has a nice article about the culture at Cerner (registration required).
Buy List Updates
This week, Deutsche Bank initiated coverage of Wabtec (WAB) with a Buy rating. Naturally, this comes after a strong upward move from the stock. Since July 25, WAB has gained 18.2%. In July, the railroad-services company missed earnings and lowered guidance. The problem is their freight business, but I suspect they may have been too conservative. Look for an earnings rebound here. This week, I’m lifting my Buy Below on Wabtec to $81 per share.
AFLAC (AFL) tends to be one of our quieter stocks, but it’s having a very good year for us. Last week, the duck stock broke out to a new all-time high. I’m expecting another good earnings report next month. AFLAC remains a buy up to $75 per share.
Hormel Foods (HRL) said that CEO Jeffery Ettinger will retire at the end of next month. Ettinger has done a great job at Hormel and I’m glad to hear that he’ll stay on as chairman. James Snee, the Spam company’s current President and COO, will become the new CEO. He’s been with the company since 1989.
The good news continues for Biogen (BIIB). Last week, the FDA fast-tracked the company’s Alzheimer’s treatment. The last earnings report was outstanding. Biogen sees earnings this year ranging between $19.70 and $20 per share. Biogen remains a buy up to $330 per share.
On Thursday, Ford Motor (F) cut its full-year earnings forecast thanks to a recall of faulty door latches. In July, the automaker said it was going to beat last year’s pre-tax profit of $10.8 billion. Now they’re expecting pre-tax profits for this year of about $10.2 billion. As of Thursday’s close, Ford yields 4.7%. I rate Ford Motor a buy any time it’s below $14 per share.
That’s all for now. Next week, we’ll get the retail sales report on Thursday. This is a key metric to watch, because consumer spending continues to be one of the bright spots in the economy. We’ll also get the latest report on industrial production. The last few reports have been surprisingly good as the dollar-induced drop in industrial production appears to be over. On Friday, we’ll get the latest CPI report. Inflation still appears to be well contained. Be sure to keep checking the blog for daily updates. I’ll have more market analysis for you in the next issue of CWS Market Review!
– Eddy
-
Morning News: September 9, 2016
Posted by Eddy Elfenbein on September 9th, 2016 at 7:03 amChina’s Reviving the American Heartland — One Low Wage at a Time
EU Finance Ministers to Consider Withholding Greece Aid
Wells Fargo Opened a Couple Million Fake Accounts
Mastercard Has Been Sued for £14 Billion in Britain’s Biggest Damages Claim
Enterprise and Williams Clash After Takeover Talks Fall Apart
SpaceX Leads Probe Into Falcon 9 Rocket Explosion
Foxconn Invests in Chinese Ride-Hailing Startup Didi Chuxing
Would Warren Buffett Buy the iPhone 7? Probably Not
France’s Total Takes Control of Barnett Shale in Texas
EU Regulators Halt Dow, DuPont Merger Review to Gather Data
Airbnb Adopts Rules to Fight Discrimination by Its Hosts
Jeff Miller: Felix, Oscar and Holmes Talk Stocks
Be sure to follow me on Twitter.
-
Historical Chart Suggests Tough Weeks for Market
Posted by Eddy Elfenbein on September 8th, 2016 at 1:17 pm -
Historic Performance by Market Size
Posted by Eddy Elfenbein on September 8th, 2016 at 10:30 amFrom the Ibbotson data, here’s the historic market performance by each market cap decline, or 10% slice. As you can see, micro-caps (the smallest decline) have done the best while the largest decile, the mega-caps, has done the worst.
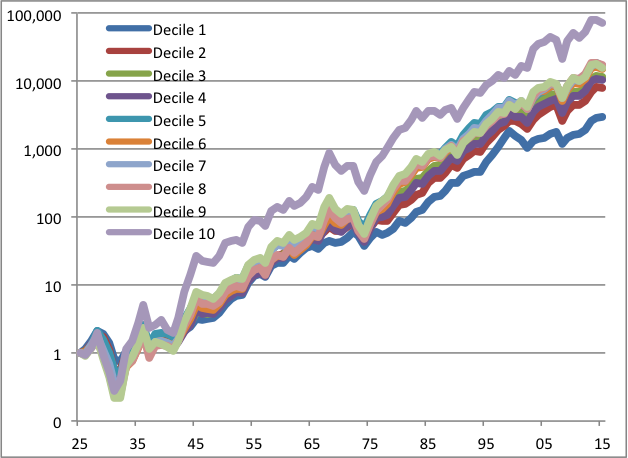
I’ve always been a bit skeptical of the idea of a small-cap premium. For one, you can see that outside the very big and very small, the other deciles are pretty much grouped together. That’s after nine decades. Also, the small-cap premium is highly volatile. In fact, Decline 10 had a run of 55 years when it lagged Decile One.
Here’s the annualized total return over the last 90 years.
 Eddy Elfenbein is a Washington, DC-based speaker, portfolio manager and editor of the blog Crossing Wall Street. His