-
CWS Market Review – June 26, 2015
Posted by Eddy Elfenbein on June 26th, 2015 at 7:08 am“Summertime, and the livin’ is easy…” – Porgy & Bess
Indeed it is. We just passed the solstice and Wall Street is already in its summer doldrums. Frankly, there’s not much going on. The S&P 500 hasn’t closed more than 1.25% from 2,105 for 56 straight trading days. We haven’t had a 2% move all year. In fact, we haven’t even had a 1% move in nine weeks. That’s the longest such streak since 1993.
This market’s just dull, dull, dull.
Traders, however, don’t like a dull market. They need something—anything—to worry about. If it’s hard to find this week’s Worry of the Century, well, then they’ll keep looking around until they find something. That’s probably why the news from Greece has gotten more attention than it truly deserves. Once again, let me remind you to not lose one second of time worrying about Greece. Here’s a stat for you: Americans own $5.7 billion worth of Greek stocks. For perspective, that’s about the size of Dunkin Donuts (DNKN), which is the 110th largest stock in the mid-cap index.
In this week’s CWS Market Review, I’ll talk more about the economy. Until now, I suspected that the economy had improved this quarter. Now that we have more evidence, that case has grown much stronger. GDP for Q2 could be one of the best numbers in the last few years. You heard it here first.
I’m pleased to report that our Buy List is finishing up the first half of this year on a strong note. The Buy List has outpaced the S&P 500 for the last five days in a row. As of Thursday’s close, we’re up 5.20% for the year compared with 2.11% for the S&P 500. That’s a lead of 3.09%, which is our widest lead of the year. Let’s hope this is another market-beating year for us.
Later on, I’ll discuss the blah earnings from Bed Bath & Beyond (BBBY). It wasn’t terrible, but it wasn’t that good, either. I’ll fill you in. Also, shares of Ford Motor (F) got a nice boost this week (about time!) thanks to an upgrade from Goldman Sachs. Before I get to that, let’s look at the best personal spending report in six years.
Strongest Consumer Spending in Six Years
Next week, the U.S. economic recovery officially turns six years old. Of course, if you tell that to a lot of folks, they might be surprised that it’s even begun. I certainly know what they mean. Many home values are miles from their highs reached six or seven years ago, and millions of Americans are still looking for work.
This week, the government revised its estimate of Q1 GDP growth. The good news is that it was revised higher. The bad is it was revised up to -0.2%. In other words, the U.S. economy shrunk in real terms during the first three months of the year. So we’re six years into a recovery and we’re still seeing negative growth. That just doesn’t ring right.
This is the third time in the last five years that the first quarter has shown negative growth. Some folks on Wall Street think the government’s methodology might be off. For their part, federal number crunchers are looking into the issue. Being a market watcher, I’m not surprised by the poor GDP report. We already saw the evidence in Q1 earnings reports. Of course, part of that was due to the strong dollar. The rising greenback clearly took a bite out of profits and economic growth.
As a result, some folks were expecting more bad news as we headed into Q2. The Federal Reserve, however, said that it was a passing storm, and the evidence now suggests they were right. On Thursday, the government reported that personal income rose by 0.5% in May, and personal spending jumped by 0.9%. That’s a big number. It was the best report for spending since August 2009. Economists had been expecting an increase of 0.7%.
We won’t get the Q2 GDP report until late July, but we’ve already seen the personal spending reports for April and May. Taken together, they’re point towards a 3.1% annualized increase for personal spending in Q2. I always try to take a reality-based view of the markets and the economy, so trust me when I say that’s good news.
The government also said that jobless claims rose by 3,000. That’s not much. More importantly, they’ve come in below 300,000 for the last 16 weeks in a row. Janet Yellen and her friends at the Fed took a risk by holding out against calls for an immediate rate hike. At the same time, she communicated to the market that a rate increase is coming even if she can’t yet say when. That’s a tough balancing act. You may recall that the jobs report for March was pretty weak. In retrospect, that report appears to be an outlier.
Wall Street is now turning its eyes to next Thursday. That’s when the government will release the jobs report for June. I think we’ll see more of the same: an increase of 250,000 jobs, give or take. But more important than jobs growth is wage growth. Only recently have we had evidence that workers are getting an increase in pay. This trend needs to continue. More pay means more shoppers and that leads to more revenue.
High-Dividend Stocks Have Lagged
Once the Fed starts to increase interest rates, that will have a major shift on the markets. Actually, the shift has already started. The folks at Bespoke Investment Group divided the S&P 500 into 10 deciles sorted by dividend yield.
The decile with the lowest-yielding stocks has been the top performer so far this year while the highest-yielding decile has been the worst. That’s exactly what you’d expect in an environment of higher rates. Utility stocks have lagged while financials have led. On our Buy List, stocks like Wells Fargo (WFC) and Signature Bank (SBNY) have been among our better-performing stocks this year. I also think it’s interesting that some of our higher-yielding stocks like Ford (F) and Microsoft (MSFT) haven’t done that well.(I’ll have more on Ford in a bit.)
Second-quarter earnings will begin in a few weeks. I think we’ll see good numbers, but the open question is how much damage was caused by the U.S. dollar. For Q1, analysts were expecting a bigger impact than we got. But by looking at the recent earnings report from Oracle (ORCL), we can see that it’s still an issue. Oracle said that quarterly revenue dropped by 5%, but in constant currency, it rose by 3%.
I urge investors to focus on high-quality stocks. Stay away from regions like or China or Greece. I’m also wary of some of the recent IPOs we’ve seen. Some of the stocks on the Buy List that look particularly good at the moment are Stryker (SYK), Cognizant Technology (CTSH) and Wabtec (WAB). Boring and dependable is the way to go. Now let’s look at the recent earnings report from Bed Bath & Beyond.
Bed Bath & Beyond Earns 93 Cents per Share
It’s no secret that I’ve gotten a little frustrated with Bed Bath & Beyond (BBBY). Please don’t take this to mean that it’s a bad stock. But with our investments, I strive to see things as they are instead of how I would like them to be.
On Wednesday, Bed Bath & Beyond reported fiscal Q1 earnings of 93 cents per share. That was one penny below estimates, although it was within the company’s range of 90 to 95 cents per share. Quarterly revenues rose 3.1% to $2.74 billion which matched Wall Street’s expectations. Historically, Q1 is the weakest quarter of the year for the company.
The key number to watch is same-store sales, and that rose by 2.2%. Again, that was within the company’s range of 2% to 3%. For Q2, BBBY sees earnings ranging between $1.18 and $1.23 per share. Wall Street had been expecting $1.23 per share.
I’m not crazy about this earnings report, but honestly, I was afraid it was going to be worse. A miss of one penny per share isn’t that bad. Traders, naturally, didn’t take it well. The shares dropped as low as $67.50 on Thursday morning, which I thought was excessive. The stock came back a little later in the day to close at $69.23 per share. That’s a loss of 1.6% for the day.
The best news is that the company reiterated their full-year growth forecast. BBBY expects earnings to rise from flat to mid-single-digits. For clarity’s sake, let’s say that’s 0% to 5%. They also expect same-store sales to grow by 2% to 3%. They made $5.07 per share last year, so this year’s guidance works out to $5.07 to $5.32 per share. That means the stock is going for about 13.0 to 13.6 times this year’s earnings. By that measure, it’s hard to say that BBBY is too pricey.
Ideally, when I announce my new buys and sells each December, there shouldn’t be any major surprises. That’s still a long way off, but I will say that BBBY will need to show some improvement until then. Also in the red zone are Moog (MOG-A) and Oracle (ORCL). I’m keeping my Buy Below on BBBY at $75 per share.
Goldman Sachs Upgrades Ford Motor
I’ve been very optimistic on Ford Motor (F) for the last few weeks, and the shares haven’t done much. That’s ok-we play the long game around here. I knew that something would happen eventually.
This week, Goldman Sachs upgraded the automaker to a buy from a hold. At the same time, Goldman said to dump shares of GM (GM). Patrick Archambault said that Ford is hitting its “sweet spot” and that “The key driver is a superior growth outlook at Ford as it starts to see the volume, mix, and pricing benefits from the F-150 launch in [the second half of 2015], as well as still improving positioning in China.”
Ford’s stock, which had been as low as $14.86 last week, got as high as $15.66 this week. I don’t get why the shares are so low. The company hasn’t changed its full-year outlook at all. The stock is going for less than 10 times this year’s earnings, and next year is expected to be much better. Even with the higher price, Ford still yields 3.9%. I get why there’s a headwind against high dividend stocks, but Ford’s plainly cheap here. I rate Ford Motor a buy up to $17 per share.
That’s all for now. On Tuesday, the second quarter comes to an end. I’ll have a summary of the Buy List’s first-half performance on the website. I don’t want to get ahead of ourselves, but it’s been a good six months for us against the broader market. Let’s hope the back half goes as well as the front half. On Wednesday, the ISM report comes out along with the ADP jobs report. Then Thursday will be crowded. We’ll get the June jobs report along with initial claims on factory orders. The market will be closed on Friday, July 3 to give us a three-day weekend for Independence Day. Be sure to keep checking the blog for daily updates. I’ll have more market analysis for you in the next issue of CWS Market Review!
– Eddy
-
Morning News: June 26, 2015
Posted by Eddy Elfenbein on June 26th, 2015 at 7:03 amChinese Stock Plunge Leaves State Media Speechless
New Partnership Aims To Improve Consumer Lending In China
Why It Won’t Be a Default If Greece Misses IMF Payment Next Week
Supreme Court Allows Nationwide Healthcare Subsidies
Jeb Hensarling’s Fight Against Ex-Im Bank Succeeds, For The Moment
Capital One, Apollo Among Bidders for GE Health-Care Lender
Aetna Closing In on Deal to Acquire Humana
Charter Lists Consumer Benefits to Win Merger Approval
Is Greece Lehman Brothers, Or Is It RadioShack?
Sorry Not Sorry: Why CEOs Need To Apologize More
Whole Foods Is Ripping You Off (And It Has Been For Years)
Jeff Carter: Entrepreneurship is About Overcoming Obstacles
Howard Lindzon: Robinhood Just Made ‘Passive’ Investing Easier Than Ever
Be sure to follow me on Twitter.
-
Personal Spending Rises 0.9%
Posted by Eddy Elfenbein on June 25th, 2015 at 12:03 pmThis morning, the government said that personal spending rose by the most in nearly six years. In May, PCE jumped 0.9% which beat Wall Street’s estimates of 0.7%. Initial jobless claims rose by 3,000 but are still quite low. This is the 16th week in a row they’ve been below 300,000.
Bloomberg notes that the S&P 500 is going for its ninth-straight week without a move of more than 1%. That’s the longest streak since August 1993.
Insurance stocks are doing well thanks to the Supreme Court’s Obamacare ruling. Eli Lilly (LLY) is up 4.7% and UnitedHealth Group (UNH) is up 2.8%. On our Buy List, AFLAC (AFL) and Express Scripts (ESRX) are doing quite well today.
Bed Bath & Beyond (BBBY) is down today after its soggy earnings report, but only by 2.4%. I was afraid it might be worse.
It’s hard to provide an update on the situation in Greece as headlines are changing so quickly. The EU and Greek government haven’t yet reached a deal and time is running out. Plus, the banking system looks ever-more fragile as people pull out their money.
-
Morning News: June 25, 2015
Posted by Eddy Elfenbein on June 25th, 2015 at 7:14 amDueling Greece Plans Presented as Ministers Race for Aid Deal
Austria Bemoans Greek Lack of Urgency
ECB Holds Athens Lifeline Unchanged as Bundesbank Protests
Businesesses Worry About Shouldering Burden of Greek Debt
China Moves to Scrap Rule Limiting Bank Loans to 75% of Deposits
Slower Quarters Leave U.S. Economy’s Expansion Stuck in First Gear
TransUnion Valued at $4 Billion in I.P.O.
Monsanto Quarterly Earnings Outdo Analysts’ Expectations
Disney Raises Dividend 15%, Will Start Paying Semi-Annually
Vivendi Boosts Telecom Italia Stake as Brazil Decision Looms
Options Bears Take Fresh Stab at Biotech Amid Rally Topping 500%
The Rise of the Compliance Guru – And Banker Ire
Takata Chief Apologizes For Airbag Problems
Joshua Brown: Chart o’ the Day: Global Growth Outlook by Country
Cullen Roche: Where Does Money Come From?
Be sure to follow me on Twitter.
-
Bed Bath & Beyond Earns 93 Cents per Share
Posted by Eddy Elfenbein on June 24th, 2015 at 4:38 pmBed Bath & Beyond (BBBY) just reported fiscal Q1 earnings of 93 cents per share. That was one penny below expectations. The stock is down after-hours. Honestly, I was afraid it was going to be worse.
For the first quarter of fiscal 2015, the Company reported net earnings of $.93 per diluted share ($158.5 million) compared with net earnings for the first quarter of fiscal 2014 of $.93 per diluted share ($187.1 million). Net sales for the first quarter of fiscal 2015 were approximately $2.738 billion, an increase of approximately 3.1% from net sales of approximately $2.657 billion reported in the first quarter of fiscal 2014. Comparable sales in the first quarter of fiscal 2015 increased by approximately 2.2%, compared with an increase of approximately 0.4% in last year’s fiscal first quarter. Comparable sales for the first quarter of fiscal 2015 include an approximate 0.3% unfavorable impact from the year over year change in the Canadian currency exchange rate.
For fiscal Q2, which is more than half over, Bed Bath sees earnings ranging between $1.18 and $1.23 per share. The Street had been expecting $1.23 per share.
The Company is modeling a 2.0% to 3.0% increase for comparable sales for the fiscal 2015 second quarter and continues to model a 2.0% to 3.0% increase for the remainder of the year. Net earnings per diluted share are modeled to be in the range of $1.18 to $1.23 for the fiscal 2015 second quarter and to be between relatively flat and a mid-single digit percentage increase for the fiscal full year.
Here are some quarterly financial stats going back a few years.
Quarter Sales Gross Profit Operating Profit Net Profit EPS May-99 $356,633 $146,214 $28,015 $17,883 $0.06 Aug-99 $451,715 $185,570 $53,580 $33,247 $0.12 Nov-00 $480,145 $196,784 $50,607 $31,707 $0.11 Feb-00 $569,012 $238,233 $77,138 $48,392 $0.17 May-00 $459,163 $187,293 $36,339 $23,364 $0.08 Aug-00 $589,381 $241,284 $70,009 $43,578 $0.15 Nov-01 $602,004 $246,080 $64,592 $40,665 $0.14 Feb-01 $746,107 $311,802 $101,898 $64,315 $0.22 May-01 $575,833 $234,959 $45,602 $30,007 $0.10 Aug-01 $713,636 $291,342 $84,672 $53,954 $0.18 Nov-02 $759,438 $311,030 $83,749 $52,964 $0.18 Feb-02 $879,055 $370,235 $132,077 $82,674 $0.28 May-02 $776,798 $318,362 $72,701 $46,299 $0.15 Aug-02 $903,044 $370,335 $119,687 $75,459 $0.25 Nov-03 $936,030 $386,224 $119,228 $75,112 $0.25 Feb-03 $1,049,292 $443,626 $168,441 $105,309 $0.35 May-03 $893,868 $367,180 $90,450 $57,508 $0.19 Aug-03 $1,111,445 $459,145 $155,867 $97,208 $0.32 Nov-04 $1,174,740 $486,987 $161,459 $100,506 $0.33 Feb-04 $1,297,928 $563,352 $231,567 $144,248 $0.47 May-04 $1,100,917 $456,774 $128,707 $82,049 $0.27 Aug-04 $1,273,960 $530,829 $189,108 $120,008 $0.39 Nov-05 $1,305,155 $548,152 $190,978 $121,927 $0.40 Feb-05 $1,467,646 $650,546 $283,621 $180,980 $0.59 May-05 $1,244,421 $520,781 $150,884 $98,903 $0.33 Aug-05 $1,431,182 $601,784 $217,877 $141,402 $0.47 Nov-06 $1,448,680 $615,363 $205,493 $134,620 $0.45 Feb-06 $1,685,279 $747,820 $304,917 $197,922 $0.67 May-06 $1,395,963 $590,098 $148,750 $100,431 $0.35 Aug-06 $1,607,239 $678,249 $219,622 $145,535 $0.51 Nov-07 $1,619,240 $704,073 $211,134 $142,436 $0.50 Feb-07 $1,994,987 $862,982 $309,895 $205,842 $0.72 May-07 $1,553,293 $646,109 $154,391 $104,647 $0.38 Aug-07 $1,767,716 $732,158 $211,037 $147,008 $0.55 Nov-08 $1,794,747 $747,866 $203,152 $138,232 $0.52 Feb-08 $1,933,186 $799,098 $259,442 $172,921 $0.66 May-08 $1,648,491 $656,000 $118,819 $76,777 $0.30 Aug-08 $1,853,892 $739,321 $187,421 $119,268 $0.46 Nov-08 $1,782,683 $692,857 $136,374 $87,700 $0.34 Feb-09 $1,923,274 $785,058 $231,282 $141,378 $0.55 May-09 $1,694,340 $666,818 $142,304 $87,172 $0.34 Aug-09 $1,914,909 $773,393 $222,031 $135,531 $0.52 Nov-09 $1,975,465 $812,412 $245,611 $151,288 $0.58 Feb-10 $2,244,079 $955,496 $370,741 $226,042 $0.86 May-10 $1,923,051 $775,036 $225,394 $137,553 $0.52 Aug-10 $2,136,730 $874,918 $296,902 $181,755 $0.70 Nov-10 $2,193,755 $896,508 $305,110 $188,574 $0.74 Feb-11 $2,504,967 $1,076,467 $461,052 $283,451 $1.12 May-11 $2,109,951 $857,572 $288,948 $180,578 $0.72 Aug-11 $2,314,064 $950,999 $371,636 $229,372 $0.93 Nov-11 $2,343,561 $958,693 $357,020 $228,544 $0.95 Feb-12 $2,732,314 $1,163,669 $550,765 $351,043 $1.48 May-12 $2,218,292 $887,199 $313,398 $206,836 $0.89 Aug-12 $2,593,015 $1,032,669 $365,137 $224,330 $0.98 Nov-12 $2,701,801 $1,074,010 $361,649 $232,750 $1.03 Feb-13 $3,401,477 $1,394,877 $598,034 $373,872 $1.68 May-13 $2,612,140 $1,032,971 $323,101 $202,490 $0.93 Aug-13 $2,823,672 $1,113,484 $389,766 $249,304 $1.16 Nov-13 $2,864,837 $1,121,690 $374,647 $227,197 $1.12 Feb-14 $3,203,314 $1,297,437 $527,073 $333,299 $1.60 May-14 $2,656,698 $1,030,885 $300,701 $187,052 $0.93 Aug-14 $2,944,905 $1,134,045 $368,741 $223,953 $1.17 Nov-14 $2,942,980 $1,128,974 $352,683 $225,408 $1.23 Feb-15 $3,336,593 $1,325,875 $532,168 $321,061 $1.80 May-15 $2,738,495 $1,044,133 $273,269 $158,451 $0.93 Q1 GDP Revised Higher to -0.2%
Posted by Eddy Elfenbein on June 24th, 2015 at 12:58 pmThe first quarter was bad for the economy but not quite as bad as previously thought. This morning, the government revised Q1 GDP up to -0.2%. That matches what the Street had been expecting.
The harsh winter weather and port delays that damped growth at the start of the year have given way to increases in consumer spending and housing, bolstering Federal Reserve projections that the setback was temporary. Still, pockets of weakness remain as lower oil prices continue to hinder investment in the energy industry and a firm dollar restrains global sales.
“What we are seeing here does validate the story that the first-quarter weakness was transitory,” said Michael Feroli, chief U.S. economist at JPMorgan Chase & Co. in New York, who correctly forecast GDP. “The consumer is coming back to overall decent growth.”
Ford Rallies on Goldman Upgrade
Posted by Eddy Elfenbein on June 24th, 2015 at 12:06 pmShares of Ford Motor (F) are finally getting some love. The stock is up today thanks to an upgrade from Goldman Sachs. They raised the stock from a buy to a hold. The shares, which had been as low as $14.86 one week ago, have been as high as $15.66 today.
The firm increased its price target to $19 from $18, citing Ford’s “superior” growth outlook and its improving positioning in China.
Goldman expects earnings momentum to accelerate through 2016 driven by production of the new F-150 pick up truck.
Analysts noted that Ford is seeing strong truck pricing and has limited exposure to China.
Bed Bath & Beyond (BBBY) reports after the closing bell. Spencer Jakab looked at the stock in today’s WSJ:
So Bed Bath is looking a bit rumpled. But management’s strong track record and the company’s proven ability to throw off cash should make it interesting at its current price to both public and private investors.
Last July, the company issued debt and launched a big share buyback. The moves were perhaps opportunistic, due to Bed Bath’s depressed share price. There is also the possibility they were meant to make it a less attractive leveraged-buyout candidate.
Bed Bath’s debt-adjusted market value is currently just 7.1 times earnings before interest, taxes, depreciation and amortization. That is a 7% discount to its 10-year average.
Meanwhile, its price and pristine balance sheet could still make the company interesting to private-equity firms.
Morning News: June 24, 2015
Posted by Eddy Elfenbein on June 24th, 2015 at 7:03 amGreece Handed New Terms as Tsipras Approaches Decision Time
Italy Says Greece Must Act To Get Deal
Hedge Fund ‘War Games’ in Monaco Predict No Greek Euro Exit
German Business Confidence Hits Four-Month Low in June
Spain Says Economy Growing At Fastest Rate Since 2008
Korea Fund Has $18 Billion at Stake Backing Samsung on C&T
Australia Commits to China-Led Bank
U.S. Firms Fear Financing Drought as Deadline Looms For Trade Bank
As U.S. Probes $12.7 Trillion Treasury Market, Trader Talk Is a Good Place to Start
Ford Embraces Car-Sharing and Electric Bikes on a Crowded Planet
Monsanto CEO Calls Syngenta Approach ‘A Long Game’
IBM and Box Forge Global Partnership to Transform Work in the Cloud
Wal-Mart to Impose Charges on Suppliers As Its Costs Mount
Howard Lindzon: Congratulations Facebook ….Time to Buy Slack
Cullen Roche: Did Schwab Just Kill the Non-Human Robo Advisor Services?
Be sure to follow me on Twitter.
The Disaster Of Confederate Monetary Policy
Posted by Eddy Elfenbein on June 23rd, 2015 at 10:37 pm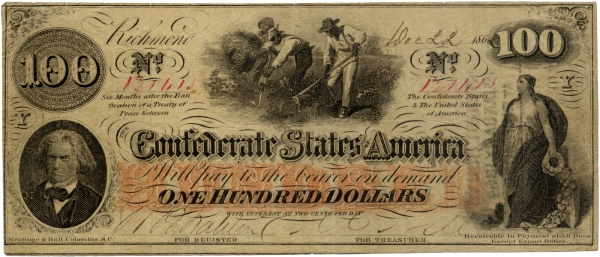
I won’t weigh in on the controversy surrounding the Confederate flag. But if you’re not persuaded by insurrection or slavery, at least consider the disaster that was Confederate monetary policy.
Wars are expensive things and the Confederacy had trouble raising revenue with taxes; nor could they borrow effectively in the international bond market. So CSA Treasury Secretary Christopher Memminger turned to an old stand-by — the printing press.
With no other avenue open, Secretary Memminger reluctantly turned to the printing press to meet the Confederacy’s financing needs. Memminger was aware that such a move would likely cause a rise in the price level and warned the government repeatedly about this danger, to no avail. The Treasury bills issued during the war had a peculiar feature: They were redeemable for gold two years after the war ended, which meant that the value of the bills was partially tied to expectations of victory for the Confederacy. So rapid was the expansion of the Confederate money supply that at one point during the war, the orders for new currency exceeded the printing capacity of the Treasury’s presses. To fill the order, the Treasury began to accept counterfeit currency as valid to further expand the supply of money.
The enormous increase in the quantity of currency precipitated an era of hyperinflation in the Confederacy as more dollars chased fewer goods. The price level in the South rose by roughly 10 percent per month during the conflict and by the end of the war, the price level had increased in the Confederacy by a factor of 92, though imports tended to inflate more quickly and exports more slowly. At the same time, the blockade, military destruction, and the loss of workers to the war caused real wages and output to fall dramatically, with per-capita consumption falling by 50 percent in real terms. Indeed, if banks had not sharply increased their reserve ratios for fear of bank runs, the inflation created by excess money in the South would likely have been even more severe.
Hyperinflation had a number of negative effects on the Southern wartime economy. As currency became useless as a store of value, the rate at which people spent their cash reserves — the velocity of money — increased, driving prices still higher. In many areas of the South, Confederate dollars became worthless unless accompanied by some valuable underlying commodity such as cotton or leather, impeding the smooth economic exchanges on which healthy economies depend. In border areas, the Union greenback currency became the preferred medium for exchange due to its superior stability. Faced with the danger of imminent invasion and the burden of supporting and hosting the military, the border areas tended to be particularly harmed by the war.
The Confederate government passed the Currency Reform Act of 1864 in an effort to stem the rampant inflation ravaging the South. The Act effectively removed one third of all currency in the South from circulation by mandating that all large denomination bills be converted to 4 percent Treasury bonds before April 1, 1864, and imposing a 3-to-2 redemption ratio for small bills after the deadline. As people tried to get rid of their large notes, velocity spiked and in the months prior to the deadline, inflation rose to 23 percent a month. In the summer of 1864, though, price levels in the Confederacy finally stabilized and even declined slightly, just as monetary theory would predict following a contraction in the money supply. However, in the face of continuing pressure to meet war obligations, Congress authorized the printing of an additional $275 million in August of 1864, mostly reversing the effects of the Currency Reform Act.
In contrast with the South, the Union successfully raised the $2.3 billion necessary to fund its war effort without causing hyperinflation. Though inflation was high in the North during the war — prices doubled in most Northern cities — it paled in comparison to the hyperinflation that plagued the Confederacy. The North drastically changed its tax collection system and financial infrastructure to accommodate the burdens of a long, expensive war. These wartime changes ultimately helped reshape the economic face of America.
Whereas the South was mostly unable to raise funds through loans, the North financed roughly 65 percent of its war effort through borrowing. Wealthy Philadelphia financier Jay Cooke successfully orchestrated the sale of huge numbers of war bonds. In order to sell these issues, Cooke launched a massive advertising campaign aimed at middle- and working-class families who traditionally were not seen as a major source of funds. His campaign was a success, with almost 1 million working families purchasing war bonds. This advertising effort presaged the modern era in which bond issues to the general public were used to help pay for wars.
During the war, the Union also managed to expand its tax base and revamp its collection system. After some initial tax measures in 1861, including the first federal income tax in U.S. history, the Union passed the Internal Revenue Act of 1862 which raised the income tax, enacted luxury and consumption taxes, and created the Bureau of Internal Revenue. In contrast to the Confederate bureaucracy where central control was weak and administrative capability lacking, the Bureau of Internal Revenue streamlined federal tax collection, a process so effective that the North raised 20 percent of its wartime revenue through taxation.
The Union Congress also passed several important pieces of financial legislation during the Civil War. In 1861, the financial demands of the war began to deplete the gold reserves of both the banking sector and the Treasury. In response, private banks ceased redeeming currency for gold, and soon the Treasury followed suit. The government passed the Legal Tender Act of 1862, which allowed the issuance of legal tender currency not backed by gold. This marked the first time in U.S. history that a fiat currency, or a currency not backed by some underlying commodity, was used as legal tender. A year later the Union government passed the National Banking Act of 1863 which created a system of nationally chartered and regulated banks to ensure a market for Union war bonds. Preexisting banks were given very strong incentives to become nationally chartered. Once chartered they were subject to federal reserve requirements, had to accept all other national banks’ currencies at face value, and had to hold federal bonds as collateral against note issue.
Both the Legal Tender Act and the National Banking Act were intended to be temporary measures to meet the exigencies of war. However, both sets of reforms lasted long after the conflict ended. More broadly, these acts, coupled with the expansion of taxation and the creation of the Bureau of Internal Revenue, marked an important shift in the power of the U.S. government. After the Civil War, the federal government had much more control over banking regulation and monetary policy, and much more power over the states generally.
Buy List Closes at YTD High
Posted by Eddy Elfenbein on June 23rd, 2015 at 4:32 pmThe Nasdaq Composite closed today at an all-time high, and the S&P 500 closed at its highest level since May 22.
Our Buy List closed at its YTD high, now up 5.93% for the year (dividends not included). The S&P 500 is up 3.17% on the year. Our current lead over the S&P 500 is 276 basis points which is the second-widest this year. On March 31, we were leading by 282 basis points.
I haven’t included dividends in this post because I didn’t have the time, but please know that dividends are part of my final calculations. I’m not trying to hide anything. The S&P 500 does yield a bit more than our Buy List, but it’s not that big of a factor.
-
Archives
- June 2026
- May 2026
- April 2026
- March 2026
- February 2026
- January 2026
- December 2025
- November 2025
- October 2025
- September 2025
- August 2025
- July 2025
- June 2025
- May 2025
- April 2025
- March 2025
- February 2025
- January 2025
- December 2024
- November 2024
- October 2024
- September 2024
- August 2024
- July 2024
- June 2024
- May 2024
- April 2024
- March 2024
- February 2024
- January 2024
- December 2023
- November 2023
- October 2023
- September 2023
- August 2023
- July 2023
- June 2023
- May 2023
- April 2023
- March 2023
- February 2023
- January 2023
- December 2022
- November 2022
- October 2022
- September 2022
- August 2022
- July 2022
- June 2022
- May 2022
- April 2022
- March 2022
- February 2022
- January 2022
- December 2021
- November 2021
- October 2021
- September 2021
- August 2021
- July 2021
- June 2021
- May 2021
- April 2021
- March 2021
- February 2021
- January 2021
- December 2020
- November 2020
- October 2020
- September 2020
- August 2020
- July 2020
- June 2020
- May 2020
- April 2020
- March 2020
- February 2020
- January 2020
- December 2019
- November 2019
- October 2019
- September 2019
- August 2019
- July 2019
- June 2019
- May 2019
- April 2019
- March 2019
- February 2019
- January 2019
- December 2018
- November 2018
- October 2018
- September 2018
- August 2018
- July 2018
- June 2018
- May 2018
- April 2018
- March 2018
- February 2018
- January 2018
- December 2017
- November 2017
- October 2017
- September 2017
- August 2017
- July 2017
- June 2017
- May 2017
- April 2017
- March 2017
- February 2017
- January 2017
- December 2016
- November 2016
- October 2016
- September 2016
- August 2016
- July 2016
- June 2016
- May 2016
- April 2016
- March 2016
- February 2016
- January 2016
- December 2015
- November 2015
- October 2015
- September 2015
- August 2015
- July 2015
- June 2015
- May 2015
- April 2015
- March 2015
- February 2015
- January 2015
- December 2014
- November 2014
- October 2014
- September 2014
- August 2014
- July 2014
- June 2014
- May 2014
- April 2014
- March 2014
- February 2014
- January 2014
- December 2013
- November 2013
- October 2013
- September 2013
- August 2013
- July 2013
- June 2013
- May 2013
- April 2013
- March 2013
- February 2013
- January 2013
- December 2012
- November 2012
- October 2012
- September 2012
- August 2012
- July 2012
- June 2012
- May 2012
- April 2012
- March 2012
- February 2012
- January 2012
- December 2011
- November 2011
- October 2011
- September 2011
- August 2011
- July 2011
- June 2011
- May 2011
- April 2011
- March 2011
- February 2011
- January 2011
- December 2010
- November 2010
- October 2010
- September 2010
- August 2010
- July 2010
- June 2010
- May 2010
- April 2010
- March 2010
- February 2010
- January 2010
- December 2009
- November 2009
- October 2009
- September 2009
- August 2009
- July 2009
- June 2009
- May 2009
- April 2009
- March 2009
- February 2009
- January 2009
- December 2008
- November 2008
- October 2008
- September 2008
- August 2008
- July 2008
- June 2008
- May 2008
- April 2008
- March 2008
- February 2008
- January 2008
- December 2007
- November 2007
- October 2007
- September 2007
- August 2007
- July 2007
- June 2007
- May 2007
- April 2007
- March 2007
- February 2007
- January 2007
- December 2006
- November 2006
- October 2006
- September 2006
- August 2006
- July 2006
- June 2006
- May 2006
- April 2006
- March 2006
- February 2006
- January 2006
- December 2005
- November 2005
- October 2005
- September 2005
- August 2005
- July 2005
 Eddy Elfenbein is a Washington, DC-based speaker, portfolio manager and editor of the blog Crossing Wall Street. His