-
RIP: Irving Kahn
Posted by Eddy Elfenbein on February 26th, 2015 at 5:03 pmIrving Kahn has died at the age of 109. He was a student of Benjamin Graham and later, chairman emeritus of Kahn Brothers Group Inc. He started working on Wall Street in 1928.
The crash of 1929, Mr. Kahn told an interviewer in 2012, taught him that “the gambling nature of Wall Street has little or no interest in the serious, underlying nature of businesses.” He described rapid trading, then and now, as “crazy competition that had no connection to the real facts.”
His central goal as an investor, he said, was always “to know much more about the stock I’m buying than the man who’s selling does.”
For Mr. Kahn, the most important quality an investor could possess was patience. “You gain much more by slow investing and concentrating on what you know,” he said in 2012, “than on fast investing, which is nothing more than gambling.”
In an article in the Financial Analysts Journal in 1977, Mr. Kahn set out seven “guidelines for intelligent investing.” Among them: “Don’t depend on recent or current figures to forecast future prices….Capital is always at risk unless you buy better than average values….Don’t trust quarterly earnings….Look beyond the one or two largest companies in a given industry.”
He concluded, “The analyst must both practice, and to his client preach, patience.”
Kahn’s sister also lived to 109. His brother died at 101 and another sister lived to 103.
Asked on Thursday if he had any thoughts on Mr. Kahn, Warren Buffett —who also studied under Mr. Graham—joked, “I’d rather have Irving’s thoughts on longevity.”
-
Q4 Earnings Calendar
Posted by Eddy Elfenbein on February 26th, 2015 at 4:13 pmHere’s the list of our stocks and their reports for this earnings cycle.
Stock Symbol Date Estimate Result Wells Fargo WFC 14-Jan $1.02 $1.02 eBay EBAY 21-Jan $0.89 $0.90 Signature Bank SBNY 22-Jan $1.56 $1.60 Microsoft MSFT 26-Jan $0.71 $0.71 Stryker SYK 27-Jan $1.45 $1.44 Qualcomm QCOM 28-Jan $1.25 $1.34 CR Bard BCR 29-Jan $2.24 $2.29 Ford Motor F 29-Jan $0.23 $0.26 Moog MOG-A 30-Jan $0.87 $0.86 AFLAC AFL 3-Feb $1.29 $1.29 Fiserv FISV 3-Feb $0.89 $0.89 Cognizant Technology CTSH 4-Feb $0.65 $0.67 Ball Corp. BLL 5-Feb $0.85 $0.84 Snap-on SNA 5-Feb $1.81 $1.97 Wabtec WAB 18-Feb $0.94 $0.95 Hormel Foods HRL 19-Feb $0.64 $0.69 Express Scripts ESRX 23-Feb $1.38 $1.39 Ross Stores ROST 26-Feb $1.11 $1.20 Hormel Foods and Ross Stores have quarters that end in January.
Not Seasonally-Adjusted CPI
Posted by Eddy Elfenbein on February 26th, 2015 at 11:14 amIt’s hard to explain how dramatic the price plunge has been. This chart helps:
With deflation, here’s the change in real AHE. Workers got their biggest real increase in wages in years.
Inflation Falls 0.7% in January
Posted by Eddy Elfenbein on February 26th, 2015 at 9:49 amStill more deflation in the U.S. The latest CPI report showed that consumer prices fell 0.7% in January. Of course much of that is due to the collapse in oil prices. The “core” CPI, which excludes food and energy, rose 0.2%.
Thanks to the lower prices, the real or inflation-adjusted increase in wages was very good. We got the average hourly earnings report a few weeks ago, but now we see that the “real” increase was 1.2% for January. In other words, American workers got their biggest raise in years.
There was also a big jump in initial jobless claims this morning. Jobless claims rose 31,000 to 313,000. That’s huge but I’ll warn you that this series can bounce around a lot. Just a few weeks ago, we had some of our lowest reports in decades. So before anyone worries about weakness in the job market, I want to see if this trend is confirmed by more data.
Morning News: February 26, 2015
Posted by Eddy Elfenbein on February 26th, 2015 at 7:03 amGerman Unemployment Rate Stays at Record Low in February
Populism Spans Globe After Piketty’s Message Resounded
Oil Prices Fluctuate as Market Remains Oversupplied
How Obamacare’s Tax Complications Are Playing Out
FCC on Brink of Broadband Transformation
The Push for Net Neutrality Arose From Lack of Choice
Spain’s Iberdrola to Buy UIL Holdings for About $3 Billion
AB InBev Profit Lifted by U.S. Recovery
GM Cuts Capacity, Jobs in Indonesia, Where Japanese Dominate
Morgan Stanley to Pay $2.6 Billion to Settle Mortgage Cases
Standard Chartered Just Replaced its CEO With JPM Jamie Dimon’s Reject
Grand Central: That Didn’t Go Well, Madame Chair
Howard Lindzon: Kill all the Economists…and Remember YahooBaba and BabaHoo?
Joshua Brown: Twenty Best Investing Blogs for College Students
Be sure to follow me on Twitter.
The Nasdaq Divided by the S&P 500
Posted by Eddy Elfenbein on February 26th, 2015 at 12:25 amWith the Nasdaq Composite closing in on a record, I thought it would be a good time to look at how the Nasdaq has performed relative to the S&P 500. The graph below is the Nasdaq divided by the S&P 500.
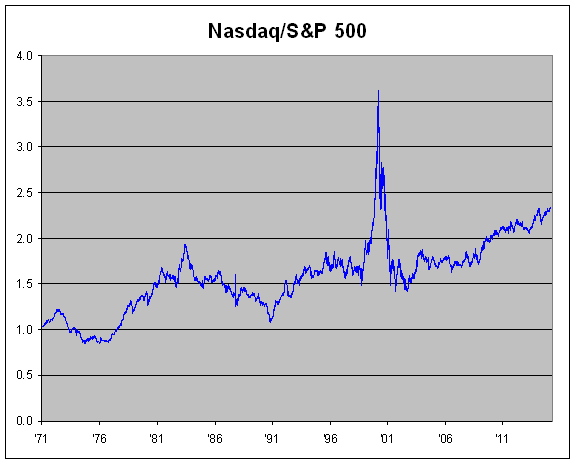
What catches my attention is how absurd the Nasdaq was in 2000. That line is a complete outlier. While the Nasdaq has outpaced the S&P 500 over the last few years, it’s nothing like it was 15 years ago.
The Nasdaq Finally Falls
Posted by Eddy Elfenbein on February 25th, 2015 at 8:42 pmAfter 10-straight up days, the Nasdaq finally fell today. The index lost a grand total of 0.98 points today which is -0.01973%. I hope we’re able recover from this setback.

Before the 10-day streak, the index had rallied 10 times in 16 sessions. The Nasdaq Composite closed today at 4,967.14. The all-time close was 5,048.62 on March 10, 2000.
The 20 Best Investing Blogs of 2015
Posted by Eddy Elfenbein on February 25th, 2015 at 8:38 pmI’m happy to be named as one of the 20 Best Investing Blogs of 2015 by the good folks at The College Investor. To celebrate, I’ll be having a kegger at the Delta Tau Chi house.
Morning News: February 25, 2015
Posted by Eddy Elfenbein on February 25th, 2015 at 7:04 amInvestors Who Held Nerve With Greece Reap World’s Best Bond Returns
HSBC, Europe’s Biggest Bank, To Testify on Tax Scandal
Net Neutrality a Big Step Nearer as Congress Republicans Concede Fight
Oil Rises to $59 as Saudis Say Demand Growing
Obama Vetoes Keystone XL Pipeline, Leaving It In Limbo
Hewlett-Packard Shares Take a Beating on Poor Sales
These Charts Show How Far Google and Facebook Are Ahead of Twitter
Lowe’s Reports Fourth Quarter Sales And Earnings Results
Black Friday Was Biggest Sales Day Ever at Home Depot
Comcast’s NBCUniversal Calls for Better Audience Measurement
Lego Reports Rise in Profit in 2014
Putting a Price on Simon Kuznets’s Nobel in Economics
How an Undocumented Immigrant From Mexico Became a Star at Goldman Sachs
Jeff Carter: Risk and Investing
Cullen Roche: Why Expectations-Based Econ Models Don’t Work
Be sure to follow me on Twitter.
The SRS for the NCAA Tournament
Posted by Eddy Elfenbein on February 24th, 2015 at 11:57 pmThis post is a small a detour from finance, but I found it interesting—and it’s probably interesting to maybe five other people on the planet.
Still, I wanted to calculate the Simple Ratings System for the seeds in the NCAA Basketball Tournament. Not the teams, but the seeds.
I had no idea how to do this, but I focused on the task and eventually figured it out. I love that sense of satisfaction when you accomplish something you thought was beyond you.
First, let me explain what the Simple Ratings System (SRS) is. Well, it’s exactly that—a simple way to give a quantitative rating to a sports team based on its record. Sabermetricians have been using it for years.
Here’s the idea: Take any sports league and calculate the average per-game point differential for every team in the league. Let’s say the Orangutans have scored, on average, 5 points more than their opponents each game.
You also see that the Orangutans’ opponents score, say, 2 points more on average than their opponents. Adding two together means the Orangutans are 7 points better than average. But wait—when we plug in 7 for the Orangutans’ margin of victory, that changes all the numbers for their opponents, and that comes back and changes all the numbers for the Orangutans. This loop will repeat itself again and again and again. Eventually, though, the numbers stop changing and you have your results. (This is what I was trying so hard to figure out.)
I wanted to calculate the SRS for the seeds of the NCAA Basketball Tournament. I took all the games of the last 30 years which is when it expanded to 64 teams. Since every team but one is knocked out, each year has 63 games. I didn’t include the play-in games since those are match-ups of same seeds. I also took out later games where same seeds met. There were 21 games like that and it only happens in the Semi-Finals or Finals.
Here’s what I got:
 Eddy Elfenbein is a Washington, DC-based speaker, portfolio manager and editor of the blog Crossing Wall Street. His