-
Morning News: March 18, 2015
Posted by Eddy Elfenbein on March 18th, 2015 at 7:09 amJapan’s Businesses Respond to Abe’s Push for Higher Wages
OECD Sees Stronger Europe, Japan Growth as Reform Need Upheld
Euro Fetching Less Than $1 Becomes Hot Call for Options Traders
Protesters, Police Clash Near New European Bank HQ in Frankfurt
George Osborne Set to Unveil U.K. Budget
Sterling Hits 5-year Low Vs. Dollar as Investors Push Back Rate Hike Bets
Oil Drops to Six-Year Low as U.S. Index Futures Fall
Fed Rate Watch — What Investors Should Be Looking for From Janet Yellen
California Tightens Water Restrictions as Drought Worsens
The Big Number in Tencent’s Earnings
With Revenue Flat, Oracle Blames Strong U.S. Dollar
Lyft Takes Over SXSW to Prove It’s Nothing Like Uber
Gulf Carriers Strike Back at U.S. Campaign to Re-examine Open-Skies Agreements
Cullen Roche: A World Without the Federal Reserve
Credit Writedowns: Currency Wars, the Swiss Franc, Policy Divergence and Fed Rate Hikes
Be sure to follow me on Twitter.
-
Oracle Raises Dividend
Posted by Eddy Elfenbein on March 17th, 2015 at 5:58 pmOracle (ORCL) just raised its dividend by 25%. The quarterly payout will rise from 12 to 15 cents per share. The company earned 68 cents per share last quarter.
Net income fell 2.7% from a year earlier to $2.5 billion, or 56 cents a share, from $2.57 billion, also 56 cents a share, a year earlier. Per-share earnings remained flat because Oracle’s share count declined, following the company’s stock buybacks.
Excluding stock compensation and other items, Oracle said it would have earned 68 cents a share, in line with the average of analyst estimates compiled by Thomson Reuters.
Oracle’s quarterly financials are a window into the transition it and most of its business-technology peers are making from selling high-price traditional software installed on computers to software delivered over the Web, often sold to a broader base of customers.
Oracle has warned the transition will be bumpy, which was reflected in the latest results. Sales of new software licenses, which are closely tracked by Wall Street, fell 6.9% from a year ago.
-
Morning News: March 17, 2015
Posted by Eddy Elfenbein on March 17th, 2015 at 7:15 amJapan’s Central Bank Warns of Temporary Return to Deflation
Saudi Arabia Needs More Oil to Feed Local Refinery Expansion
Greece Grabs Cash as More Than $2 Billion in Payouts Loom
As Cyprus Recovers From Banking Crisis, Deep Scars Remain
Why Social Security Benefit Rules Are Making Inequality Worse
FOMC: Less Patience, Still Cautious
The US Government ‘Improperly’ Spent $125 Billion Last Year
EBay Set to Open New Section on Its Site for Sotheby’s Auctions
Pinterest Valued at $11 Billion After Latest Round of Funding
Orange to Invest in Networks to Boost Earnings
Sony Profits Boosted By Film Studio
Super Mario to Go Mobile as Nintendo Ventures Into Smartphone Games
Bill Gross’s Replacements Thrive at Pimco
Roger Nusbaum: Deflation in the USA?
Joshua Brown: QOTD: Miraculously Alive and Well
Be sure to follow me on Twitter.
-
Morning News: March 16, 2015
Posted by Eddy Elfenbein on March 16th, 2015 at 7:06 amGlobal Recovery Fragile, India a Bright Spot – Lagarde
China Overtakes Germany as World’s Third-Largest Arms Exporter
China Consumer Show Targets Volkswagen, Nissan, Mercedes
Speculators Least Bullish on Oil Since 2013 as Stockpiles Swell
Dollar Weakens From 12-Year High Versus Euro Before Fed Meeting
Lew Warns Congress Over US Debt Ceiling
New GE Capital Owners Tipped to Push Growth Button
Holcim, Lafarge Posturing on Merger Terms Threatens Deal
Siemens Cheers Euro Slump as Emerson Eases Dollar’s Sting
Scripps Networks Interactive to Acquire Controlling Interest In Polish TV Operator TVN
Uber Is The World’s Largest Job Creator, Adding About 50,000 Drivers Per Month
How to Fund a Roth IRA Through a Standard 401(k)
Jeff Carter: Who Will Buy The Apple Watch?
John Hempton: Rolls Royce and the Sequoia Letter
Be sure to follow me on Twitter.
-
CWS Market Review – March 13, 2015
Posted by Eddy Elfenbein on March 13th, 2015 at 7:08 am“It is a capital mistake to theorize before one has data. Insensibly, one begins to twist facts to suit theories, instead of theories to suit facts.” – Arthur Conan Doyle
As Europe has embarked on Quantitative Easing, the U.S. stock market has suddenly gotten a bit more volatile. The S&P 500 has moved more than 1% in three of the last five days. That didn’t happen once in the preceding 16 days. This week, the S&P 500 broke below its 50-day moving average. We’re still above the 200-day moving average, but that may not last much longer.
There’s clearly a growing nervousness in the air. The Federal Reserve meets again next week, and they seem ready to move ahead with interest-rate hikes, perhaps as soon as June. Bond yields in Europe are ridiculously low. The German 10-year bond is now below 0.2%. Their seven-year bond is negative! The euro is at a 12-year low against the dollar, and for the first time since 2002, the euro and the dollar may actually reach parity. Only ten months ago, the euro was worth $1.39.
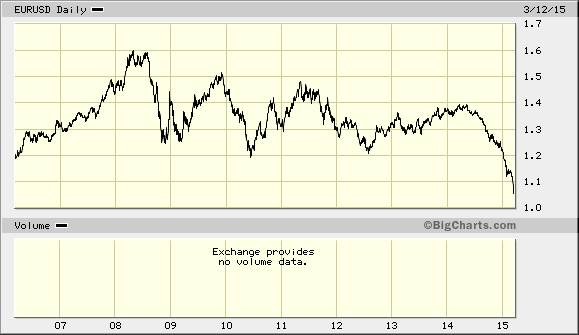
We may be nearing the point where the strong dollar is doing more harm than good. This week, Intel (INTC) slashed its Q1 revenue forecast by $1 billion, and part of the reason is the rising dollar. That’s what I want to take a closer look at this week. I always think it’s interesting how when people get nervous, they flock towards high-quality stocks. Not surprisingly, our Buy List has outpaced the S&P 500 for the last seven days in a row.
In last week’s CWS Market Review, I gave you a sample $50,000 portfolio based on our Buy List. I mentioned in passing that two of those stocks, Qualcomm (QCOM) and Wells Fargo (WFC), may soon be raising their dividends. As it turned out, both stocks raised their dividends this week. After Wells Fargo got a clean bill of health from the Fed’s latest stress test, they said they’re going to raise their quarterly dividend by 7%. Qualcomm is upping its dividend by 14%. I’ll have more to say about both stocks later on. I’ll also profile Oracle’s (ORCL) fiscal-Q3 earnings report, which is due out on Tuesday. But first, let’s follow Sir Arthur’s advice and look at the facts.
The Surging Dollar May Soon Become a Problem
This is a confusing time for investors. Europe is starting a giant case study in monetary policy. The euro is sinking, oil prices are moving back down and several stock markets in Europe are doing very well. Slowly, it seems, Europe is getting back on its feet.
Looking at bond yields across Europe is almost comical. As the European Central Bank gobbles up bonds, the yields move ever lower. Last week an energy company, GDF Suez, issued two-year notes with a 0% coupon. The premium that U.S. Treasuries pay over German bunds is at a 25-year high. Even the Italian 10-year is below 1.2%!
The Strong Dollar Trade had an initial beneficial impact for American consumers. Energy prices plunged, as did other commodities. But it’s not over yet. Gold, for example, had a brief rally, but that’s come to an end. In the last seven weeks, gold has fallen $150 to $1,152 per ounce. West Texas Crude also had a small rally, but that’s faded as well. Spot crude is back below $47 per barrel.
The problem is that the strong dollar eventually hurts U.S. competitiveness. That’s compounded by the fact that the deleterious effects of the strong dollar are hard to see. Last week, I talked about the falling outlook for corporate earnings. So far, that’s the major impact negative impact of the rising dollar.
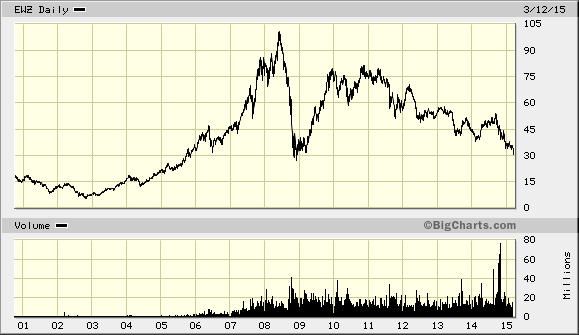
But that’s only in America. One area which has felt the blow of the rising greenback is emerging markets. Recently, the Emerging Markets ETF (EEM) fell for eight straight days. Countries like Brazil, South Africa and Turkey have been hammered this year, and their currencies are plunging. If you recall, emerging markets got roughed up two years ago during the Taper Tantrum. What we’re seeing now is much the same thing. Check out the chart of the once-popular Brazil ETF (EWZ). In less than six years, it jumped 19-fold. Those days are over:
When the dollar rises, it makes U.S.-made goods more expensive. We may even see subdued economic growth for Q1. Forecasters have been cutting back their forecasts. While Americans see the benefits of cheaper imported goods, we’re also starting to see a slowdown in manufacturing employment. That doesn’t yet impact consumption, but if it continues, it will. I try to avoid saying where the dollar will go, or where it ought to be. Instead, I prefer to say that a strong dollar is a reality and it has certain foreseeable impacts.
I want to be clear that we’re not at the point where the dollar is a problem. We’re currently in a happy place where all the trends are supporting the rising dollar. Europe and Asia desperately need a strong dollar. Americans are plenty happy to buy cheap foreign stuff. Plus, our economy and labor market are growing again. So much so that our experiment with rock-bottom interest rates may end soon.
So far, every prediction that the Federal Reserve is about to raise rates has been wrong. But the Fed meets again next week, and Wall Street now realizes that the Fed is serious this time. The policy statement will come out on Wednesday, and investors will be watching to see if the Fed continues to be “patient” with regard to its timetable for raising rates.
As long as interest rates remain low, high-quality stocks are the best place to be for investors. You should pay special attention to Buy List stocks with solid dividends. At the moment, some of the especially good bargains on our Buy List are Ford (F), Microsoft (MSFT) and a stock that I’m about to tell you a little more about, Qualcomm (QCOM).
Qualcomm and Wells Fargo Raise Their Dividends
After the closing bell on Monday, Qualcomm (QCOM) announced that it’s raising its quarterly dividend by 14%. The company also announced a share-buyback plan of $15 billion. That’s a sizable amount, even compared with Qualcomm’s market cap of $115 billion. A lot of times, these buyback programs are back-loaded. Not this time. Of the $15 billion, Qualcomm aims to spend $10 billion within the first year.
Qualcomm’s quarterly dividend will rise from 42 to 48 cents per share. That’s $1.92 per share on the year, which works out to a yield of 2.77% based on Thursday’s closing price.
The company added:
“Our business continues to generate substantial operating cash flow, and today’s announcement represents an important step in returning that cash to our owners while still preserving the strategic flexibility needed to drive stockholder value through growth,” said Steve Mollenkopf, CEO of Qualcomm Incorporated. “I am pleased that we continue to build on our track record of returning capital to stockholders, having exceeded each of our capital-return commitments in 2014 and returned approximately $37 billion to stockholders since these programs began in 2003.”
Qualcomm said they intend to return 75% of their free cash flow to shareholders in the form of dividends and share buybacks. Last year, they returned 93% to investors.
What I found interesting is that Qualcomm said they’re going to tap the debt market to finance these gifts for shareholders. The company has plenty of cash on hand, more than $30 billion at least. I assume this is a repatriation issue, meaning Qualcomm will face a massive tax bill if this money is brought home.
Qualcomm is a good value here, and the new dividend helps. The stock is currently going for less than 14 times this year’s earnings. That’s quite good in this market. Qualcomm remains a buy up to $72 per share.
The Federal Reserve just said that it has no objection to the capital plan submitted by Wells Fargo (WFC). This means the bank can now raise its dividend to 37.5 cents per share from the current level of 35 cents per share. That’s a 7.1% increase. That’s what the bank’s board is planning to do at their meeting next month.
“We are pleased to receive the Federal Reserve Board’s non-objection to our capital plan to increase our common stock dividend and continue our strong share-repurchase activity,” said Chairman and CEO John Stumpf. “This result again demonstrates the benefit of our diversified business model and conservative risk discipline, which have positioned us well to return capital to shareholders within our targeted range while maintaining strong capital levels.”
Not everyone passed the Fed test unscathed. Bank of America got a warning. Goldman, Morgan Stanley and JPMorgan had to pare back their spending plans. The U.S. divisions of Deutsche Bank and Santander both failed. But I wasn’t worried at all about Wells Fargo. WFC continues to be the best-run big bank in America. Based on Thursday’s close, the new dividend (which isn’t official until next month) yields 2.7%. That’s a whole lot more than a German 10-year! This week, I’m raising my Buy Below for Wells Fargo to $57.
Preview of Oracle’s Earnings Report
The tech sector has been getting beaten up lately. Earlier I mentioned that Intel (INTC) cut its Q1 revenue forecast by $1 billion. Shares of Microsoft (MSFT) are 18% off their 52-week. MSFT now yields more than 3%. Many tech watchers will be paying close attention to Oracle’s (ORCL) fiscal Q3 earnings report, which comes out on Tuesday, March 17.
The database software giant seemed to have turned a corner with the last earnings report. After missing earnings for three straight quarters, Oracle beat the Street’s expectation by one penny in December. That, apparently, was a giant relief for worried tech traders. The stock responded by jumping 10% the next day to reach its highest close in 14 years. That was a classic case of good news being the lack of bad news.
It’s no secret that industry is transitioning to the cloud. While Oracle got off to a slow start, they’re closing the gap very quickly. I never count Larry Ellison out. He’s not exactly your conventional CEO, but he’s one of the true visionaries in tech. Of course, Larry’s no longer CEO. I should add that I’m not of fan of Oracle’s current structure with dual CEOs. I’ll be surprised if it lasts more than a few years.
Three months ago, Oracle told us to expect fiscal Q3 earnings between 69 and 74 cents per share. A lot of folks I’ve talked with think Oracle will disappoint. I’m not so sure. Financially, Oracle is solid. For now, I’m going to keep Oracle’s Buy Below at $48, which is rather high. I may trim it next week, depending on the earnings report. Overall, Oracle is a very good company, but this is a difficult stretch for large-cap tech.
That’s all for now. The big news next week will be the Federal Reserve meeting on Tuesday and Wednesday. Their policy statement will be released on Wednesday afternoon. The central bank will also revise its economic projections. Prior to the Fed meeting, we’ll get the report on industrial production on Monday. IP is an important indicator for the health of the economy, and I’d be concerned by any prolonged dip here. So far, it’s held up well; IP has risen for 55 of the last 67 months. Be sure to keep checking the blog for daily updates. I’ll have more market analysis for you in the next issue of CWS Market Review!
– Eddy
-
Morning News: March 13, 2015
Posted by Eddy Elfenbein on March 13th, 2015 at 7:02 amLanguage of Greek Crisis Shifts From Financial Jargon to Humiliation
With Plan to Join China-Led Bank, Britain Opens Door for Others
Nikkei Stock Average Finishes Above 19000 Mark
Modi Builds Ties in Sri Lanka Visit as China’s Clout Wanes
Russia Cuts Main Rate to 14% as Inflation Eases Amid Slump
Dollar Drop Short-Lived as Policy Divergence Prompts One-Way Bet
Wealth Gains Start to Lift More Boats
Retail Sales Plunge As Consumers Hesitate to Spend Gas Savings
Fed ‘Stress Tests’ Still Pose Puzzle to Banks
F.C.C. Sets Net Neutrality Rules
Here’s Everything That’s Wrong With Cable and Satellite TV Bills
Intel Slashes Revenue Outlook, Noting Lower Demand For Desktop Computers
Nomura, RBS Face U.S. Mortgage Trial; $1 Billion Damages at Stake
Cullen Roche: All Securities Issued Are Always Held By Someone
Joshua Brown: Another Bulls*** Myth Debunked
Be sure to follow me on Twitter.
-
Morning News: March 12, 2015
Posted by Eddy Elfenbein on March 12th, 2015 at 7:06 amEuro’s Freefall Toward U.S. Dollar Parity Continues
No Reason Why India Can’t Resume 8-9% Growth: IMF
Spain’s Banco Sabadell in Talks to Buy Britain’s TSB Group
Senate Finance Committee To Hold A Hearing on Tax Fraud
Three Banks Uncover the Path to Payouts in the Fed’s Stress Test
The U.S. Has Too Much Oil and Nowhere to Put It
Utah Passes White-Collar Felon Registry
Alibaba Invests $200 Million in Snapchat
KFC Faces Pressure After McDonald’s Says No Antibiotics in Chicken
Shake Shack Tumbles After Inaugural Earnings Fail to Impress
Dollar General Forecasts Full-Year Profit Below Estimates
Uber, Lyft Rebuffed in Bids to Deem Drivers Independent Contractors
Ellison’s Paycheck Is $103 Million and He’s Still a Bargain
Edward Harrison: Wolfgang Schaeuble the Salesman
Jeff Carter: Feedback, or Criticism?
Be sure to follow me on Twitter.
-
The Fed Gives Wells Fargo a Clean Bill of Health
Posted by Eddy Elfenbein on March 11th, 2015 at 5:26 pmThe Federal Reserve just said that it has no objection to the capital plan submitted by Wells Fargo (WFC). This means the bank can now raise its dividend to 37.5 cents per share from the current level of 35 cents per share. That’s a 7.1% increase. That’s what the bank’s board is planning to do at their meeting next month.
“We are pleased to receive the Federal Reserve Board’s non-objection to our capital plan to increase our common stock dividend and continue our strong share repurchase activity,” said Chairman and CEO John Stumpf. “This result again demonstrates the benefit of our diversified business model and conservative risk discipline, which have positioned us well to return capital to shareholders within our targeted range while maintaining strong capital levels.”
The shares are up 19 cents in after-hours trading.
-
The Dollar and Euro Move Near Parity
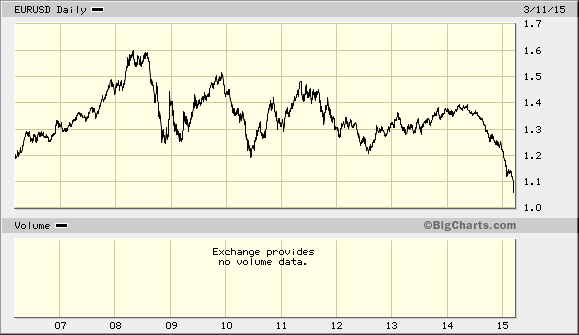
Posted by Eddy Elfenbein on March 11th, 2015 at 9:25 amThanks to the start of European QE, and the prospect for higher rates soon in the U.S., the dollar has been surging against the euro. Ten months ago, one euro was worth $1.39. Today that same euro gets you just $1.06. That’s a 12-year low. Now people are wondering if we’ll hit parity soon.
Interest rates in Europe are becoming a joke. The 10-year bond in Germany just fell to 0.2%. In other words, you get 2% combined for the entire life of the bond!
Adding to the dollar’s rally is next week’s Fed meeting. The talk on Wall Street is that the Fed will abandon its “patient” language which will set the stage for rate hikes. The last time the Fed raised interest rates was June 2006.
-
Morning News: March 11, 2015
Posted by Eddy Elfenbein on March 11th, 2015 at 7:09 amEx-Soviet Republics Feeling Putin’s Ruble Pain Now
China Data Paint Gloomy Picture
China to Increase Scrutiny of New Zealand Milk
Euro Nears Parity With U.S. Dollar
Crude Falls to One-Month Low as Glut Seen Growing, Dollar Gains
History Suggests OPEC’s Days Could Be Numbered
Next Step in Global Cost and Efficiency Program
Banking Arbitration Hurts Consumers, Regulator Says
Alibaba in Talks to Invest in Indian Online Marketplace Snapdeal
Ineos to Acquire Stakes in Igas, a Boost to British Shale Gas
UBS Poaches Bank of Montreal Oil Banking Team
Retiring Google CFO Writes The Best ‘Spend More Time With Family’ Memo Ever
Credit Writedowns: Five Investing Themes That Need Further Examination
Howard Lindzon: Charles Schwab versus The Robo’s and Wealthfront…
Be sure to follow me on Twitter.
-
Archives
- September 2026
- August 2026
- July 2026
- June 2026
- May 2026
- April 2026
- March 2026
- February 2026
- January 2026
- December 2025
- November 2025
- October 2025
- September 2025
- August 2025
- July 2025
- June 2025
- May 2025
- April 2025
- March 2025
- February 2025
- January 2025
- December 2024
- November 2024
- October 2024
- September 2024
- August 2024
- July 2024
- June 2024
- May 2024
- April 2024
- March 2024
- February 2024
- January 2024
- December 2023
- November 2023
- October 2023
- September 2023
- August 2023
- July 2023
- June 2023
- May 2023
- April 2023
- March 2023
- February 2023
- January 2023
- December 2022
- November 2022
- October 2022
- September 2022
- August 2022
- July 2022
- June 2022
- May 2022
- April 2022
- March 2022
- February 2022
- January 2022
- December 2021
- November 2021
- October 2021
- September 2021
- August 2021
- July 2021
- June 2021
- May 2021
- April 2021
- March 2021
- February 2021
- January 2021
- December 2020
- November 2020
- October 2020
- September 2020
- August 2020
- July 2020
- June 2020
- May 2020
- April 2020
- March 2020
- February 2020
- January 2020
- December 2019
- November 2019
- October 2019
- September 2019
- August 2019
- July 2019
- June 2019
- May 2019
- April 2019
- March 2019
- February 2019
- January 2019
- December 2018
- November 2018
- October 2018
- September 2018
- August 2018
- July 2018
- June 2018
- May 2018
- April 2018
- March 2018
- February 2018
- January 2018
- December 2017
- November 2017
- October 2017
- September 2017
- August 2017
- July 2017
- June 2017
- May 2017
- April 2017
- March 2017
- February 2017
- January 2017
- December 2016
- November 2016
- October 2016
- September 2016
- August 2016
- July 2016
- June 2016
- May 2016
- April 2016
- March 2016
- February 2016
- January 2016
- December 2015
- November 2015
- October 2015
- September 2015
- August 2015
- July 2015
- June 2015
- May 2015
- April 2015
- March 2015
- February 2015
- January 2015
- December 2014
- November 2014
- October 2014
- September 2014
- August 2014
- July 2014
- June 2014
- May 2014
- April 2014
- March 2014
- February 2014
- January 2014
- December 2013
- November 2013
- October 2013
- September 2013
- August 2013
- July 2013
- June 2013
- May 2013
- April 2013
- March 2013
- February 2013
- January 2013
- December 2012
- November 2012
- October 2012
- September 2012
- August 2012
- July 2012
- June 2012
- May 2012
- April 2012
- March 2012
- February 2012
- January 2012
- December 2011
- November 2011
- October 2011
- September 2011
- August 2011
- July 2011
- June 2011
- May 2011
- April 2011
- March 2011
- February 2011
- January 2011
- December 2010
- November 2010
- October 2010
- September 2010
- August 2010
- July 2010
- June 2010
- May 2010
- April 2010
- March 2010
- February 2010
- January 2010
- December 2009
- November 2009
- October 2009
- September 2009
- August 2009
- July 2009
- June 2009
- May 2009
- April 2009
- March 2009
- February 2009
- January 2009
- December 2008
- November 2008
- October 2008
- September 2008
- August 2008
- July 2008
- June 2008
- May 2008
- April 2008
- March 2008
- February 2008
- January 2008
- December 2007
- November 2007
- October 2007
- September 2007
- August 2007
- July 2007
- June 2007
- May 2007
- April 2007
- March 2007
- February 2007
- January 2007
- December 2006
- November 2006
- October 2006
- September 2006
- August 2006
- July 2006
- June 2006
- May 2006
- April 2006
- March 2006
- February 2006
- January 2006
- December 2005
- November 2005
- October 2005
- September 2005
- August 2005
- July 2005
 Eddy Elfenbein is a Washington, DC-based speaker, portfolio manager and editor of the blog Crossing Wall Street. His