-
Morning News: November 25, 2014
Posted by Eddy Elfenbein on November 25th, 2014 at 7:05 amOECD: Euro Area May Be In ‘Persistent Stagnation Trap’
ECB’s Coeure Says Officials Won’t Rush as They Debate All Assets
Germany Relies on Consumers for Growth as Investment Declines
Grand Central: The Internal, External Limits Facing BOJ Gov. Kuroda
China Won’t Consider Further Rate Cuts, Easing Until After Fourth Quarter
Santander Names New CEO As Chairwoman Botin Injects New Drive
United Technologies Replaces CEO Amid Growth Challenges
Redbox Price Hike Shows DVDs Aren’t Dead
Finra Fines Citigroup Over Acts by Analysts
Nuance Profit Tops Estimates as Healthcare Sales Rise
Kinder Morgan: Is There A Multi-Billion Dollar Elephant In The Room?
Honda Failed to Report Defects’ Full Human Toll
FBI Files Say Hedge Fund Analyst Made Millions on Tips From Dell Insider
Pragmatic Capitalism: In Energy Revolution, Bond Investors Must Keep Their Heads
Joshua Brown: The Death of the A Share (and nobody cares)
Be sure to follow me on Twitter.
-
Morning News: November 24, 2014
Posted by Eddy Elfenbein on November 24th, 2014 at 6:48 amChina Stocks Rise After Surprise Rate Cut, Yuan Drops
Greece to Negotiate Stalled Review With Troika in Paris
Germany Surprises, Helps Euro Tick Up
The $31 Billion Bet Against Brazil’s New Finance Minister
Thanksgiving In Vienna: OPEC Meeting – Is The World Oil Price Managed?
White House Threatens to Put Brakes on Alternative Fuels
Jets Are Out, Televisions In as U.S. Growth Benefits Spread
Bidding in Government Auction of Airwaves Reaches $34 Billion
BT Says It Is in Talks to Acquire 02
RenaissanceRe Holdings To Acquire Platinum Underwriters In $1.9 Billion Deal
BioMarin to Pay Up to $840 Million for Prosensa
Tesla Says in Talks With BMW Over Car Batteries, Parts
Jeff Miller: Weighing the Week Ahead: Are Investors Too Complacent?
Epicurean Dealmaker: Regrets, I’ve Had a Few
Be sure to follow me on Twitter.
-
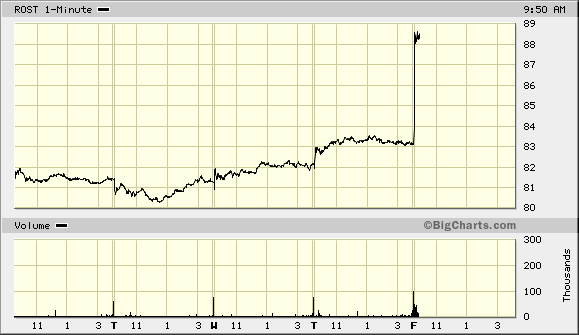
Strong Open for Ross Stores
Posted by Eddy Elfenbein on November 21st, 2014 at 9:50 amIt’s looking very good for Ross Stores ($ROST) this morning. The stock is currently up over 6% today.
-
CWS Market Review – November 21, 2014
Posted by Eddy Elfenbein on November 21st, 2014 at 7:08 am“Become more humble as the market goes your way.” – Bernard Baruch
Before I get into this week’s CWS Market Review, I have two announcements. The first is that there will be no newsletter next week. It’s Thanksgiving, and I’m taking a little break. The second is that I’ll be unveiling next year’s Buy List in the CWS Market Review on December 19, 2014, which is four weeks from today.
As always, I’ll be adding five stocks and deleting five stocks. The 2015 Buy List won’t take effect until the start of trading in January. I like to announce the names a few days ahead of time so no one can claim the positions are somehow manipulated. Later on in today’s newsletter, I’ll give you a list of some stocks I’m thinking about adding or deleting.
Now…about this lethargic stock market. The recent market hasn’t merely been slow; it’s been one of the sleepiest markets in history. Every day, it seems, the indexes climb higher, but only microscopically. The S&P 500 just closed out a five-day run where it didn’t close higher or lower by more than 0.1%. That hasn’t happened in 50 years.
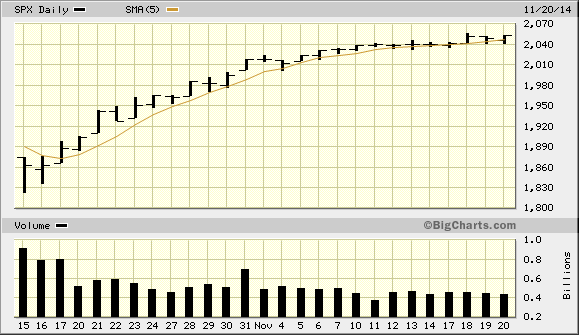
The S&P 500 hasn’t had a meaningful down day in nearly a month. The last time the index dropped by more than 0.3% (which isn’t that much) was on October 22. The S&P 500 has closed higher 19 times in the last 26 sessions, but most of those were very small increases. The index has now closed above its five-day moving average for an amazing 25 straight days. That’s the longest streak since 1986. On Thursday, the market closed at yet another all-time high.
I’m pleased to note that our Buy List continues to do well. We had two very good earnings reports this week. Medtronic jumped nearly 5% on Tuesday after it reported good earnings. Then on Thursday, Ross Stores handily beat Wall Street’s earnings consensus, and the shares are poised to move much higher. I’ll give the details on those in just a bit, but first let’s look at some ideas I’m considering for the 2015 Crossing Wall Street Buy List.
Potential Changes for Next Year’s Buy List
According to the rules of our Buy List, I select 20 stocks each year. The portfolio is then locked and sealed, and I can’t make any changes for the next 12 months. (This set-and-forget rule has probably helped me more than I realize, since it’s prevented me from dumping good names at the first sign of trouble.) Each year, I swap out five names, which means my annual portfolio turnover is just 25%.
Right now, the five names I’m considering for deletion are CA Technologies ($CA), DirecTV ($DTV), IBM ($IBM), McDonald’s ($MCD) and Medtronic ($MDT). This is just a preliminary list: there’s no guarantee that these will be the ones to be cut when I make the big announcement next month.
Let me run through some thoughts on each of the names.
We did very well with DirecTV ($DTV), and I was happy to have it on our Buy List. But now it’s time to say goodbye. If all goes according to plan, the company will soon be bought out by AT&T. I like AT&T, but I’d rather not have it on our Buy List.
Medtronic ($MDT) is in a similar position. The medical-device stock has done very well for us, and particularly well lately (I’ll discuss this week’s earnings report in a bit). But Medtronic is about to become a very different company from the one we originally bought. The Covidien deal is a gigantic undertaking. They’re basically doubling in size, and there will need to be a lot of cost-cutting. If all goes well, Medtronic will soon take the name Medtronic PLC and will be incorporated in Ireland.
IBM ($IBM) and McDonald’s ($MCD) are also problematic. I simply made a mistake with both stocks. I thought both stocks were turning around, but the problems are more serious than I imagined. I think the prospects for McDonald’s could improve, but it’s too early to say. Their sales are flat, while competitors like Chipotle are cranking same-store-sales growth of 20%. IBM made a series of errors, and I think there need to be some changes at the top. Frankly, I think the two companies share a trait: they aren’t sure what kind of business they want to be.
CA Technologies ($CA) may be the weakest of the bunch. Their sales are in a tailspin. I should have pulled the plug a long time ago. As an investor, I always need to be frank about my mistakes, and I missed how serious the problems were at CA.
Ten Possible Additions for Next Year’s Buy List
Here are ten stocks I’m strongly considering for next year’s Buy List:
Alliance Data Systems ($ADS)
Babcock & Wilcox ($BWC)
Cardtronics ($CATM)
Colgate-Palmolive ($CL)
FactSet Research Systems ($FDS)
Howard Hughes Corporation ($HHC)
SEI Investments ($SEIC)
Signature Bank ($SBNY)
Tupperware Brands ($TUP)
Westinghouse Air Brake Technologies ($WAB)
I reserve the right to change my mind over the next four weeks, but I can say that these ten stocks are under serious consideration for next year’s Buy List. I don’t want to go into more detail, though, until I’ve made my final decision. Now let’s look at some recent earnings news.
Medtronic Is a Buy up to $76 per Share
In last week’s CWS Market Review, I said that I didn’t expect a big earnings beat from Medtronic ($MDT), and I was right. On Tuesday, the medical-device maker reported fiscal Q2 earnings of 96 cents per share. That met expectations right on the nose. For comparison, the company earned 91 cents per share for last year’s Q2.
The important news is that Medtronic continues to do well. The company also took the opportunity to reiterate that the Covidien ($COV) deal is on track. They hope to close the deal by the beginning of next year. At that time, Medtronic will reincorporate in Ireland, and its new name will be Medtronic PLC. The deal is up for a shareholder vote on January 6. I think it will pass easily.
For Q2, quarterly sales came in at $4.37 billion, which was a shade more than the consensus of $4.36 billion. Medtronic also reiterated its full-year earnings outlook of $4.00 to $4.10 per share. Their fiscal year ends in April, and Medtronic has already made $1.89 for the first two quarters of this year. That means they see earnings ranging between $2.11 and $2.21 per share for the last six months of this fiscal year. Medtronic earned $2.03 for the back-half of FY 2014.
Omar Ishrak, Medtronic’s CEO, said, “Revenue growth was at the upper end of our full-year revenue outlook and within our mid-single digit baseline goal, reflecting the strong execution of our global organization.”
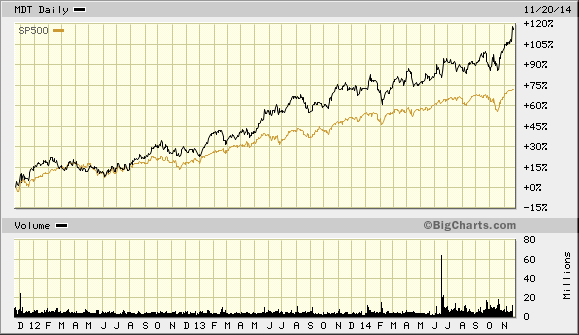
The shares popped 4.7% on Tuesday and reached a new all-time high price. In the last three years, Medtronic has gained more than 116% for us, compared with 72% for the S&P 500. As I said before, there’s a good chance that Medtronic won’t be on next year’s Buy List, but that’s due to the deal, and not to any business failure. This week, I’m raising my Buy Below on Medtronic to $76 per share.
Ross Stores Beat Earnings
In last week’s CWS Market Review, I wrote, “For Q3, Ross said it expects earnings to range between 83 and 87 cents per share. Oh, please. That’s almost certainly too low.” I was right again. The deep discounter earned 93 cents per share for its fiscal third quarter.
I wish I could say this was due to my supernatural powers to divine the future. I’m sad to say that I was simply looking at the numbers, and the math said Ross is doing just fine. Quarterly sales rose 8% to $2.599 billion. Same-store sales, which is the key number for retailers, were up by 4%. Ross continues to deliver.
The CEO said, “We are pleased with the better-than-expected sales and earnings we achieved in the third quarter. These results were driven by our ongoing ability to deliver compelling bargains to our customers, which drove above-plan sales gains and strong merchandise gross margins. Operating margin for the quarter grew 55 basis points due to a 40-basis-point improvement in cost of goods sold and a 15-basis-point decline in selling, general and administrative expenses.”
Now let’s look at their guidance. For Q4, which is the all-important holiday shopping season, Ross forecasts earnings between $1.05 and $1.09 per share. Ross earned $1.02 for last year’s Q4. For the entire year, Ross sees earnings ranging between $4.28 and $4.32 per share. That’s an increase of 10% to 11% over last year.
Ross Stores is an excellent example of our style of investing. The stock had a miserable first half of 2014. By July, shares of ROST had dropped below $62. The shares were down more than 17% on the year. But the numbers still looked good, and we held on. ROST has rallied strongly ever since. The shares are now up more than 11% for the year, which is just ahead of the S&P 500.
The stock looks to open higher on Friday morning. This week, I’m raising our Buy Below on Ross Stores to $91 per share.
That’s all for now. The stock market will be closed next Thursday for Thanksgiving. The market will close at 1 pm on Friday. This is usually the slowest trading day of the year. There’s not much reason for the market to be open, but the NYSE hates to have the exchange closed four days in a row. The only interesting economic report will come on Tuesday when we get the first revision to Q3 GDP. The initial report said that the economy grew by 3.5% for Q3. Be sure to keep checking the blog for daily updates. I’ll have more market analysis for you in the next issue of CWS Market Review!
– Eddy
-
Morning News: November 21, 2014
Posted by Eddy Elfenbein on November 21st, 2014 at 6:51 amEuro-Area Bonds Advance as Draghi Says Willing to Broaden Buying
Greece Expects Primary Budget Surplus for 2015
China Cuts Interest Rates to Revive Slowing Economy
Gold Reverses Losses After China Lowers Benchmark Interest Rates
Malaysia to End Petrol and Diesel Subsidies
Stung By Criticism, Fed Will Review How It Supervises Large Banks
Amazon’s Pricing Strategy Makes Life Miserable For The Competition
Amazon Vows to Run Its Cloud Entirely on Renewable Energy
Intel: All Is Not Well In Mobile, But We’re Not Embarrassed
Gap Cuts Profit Forecast As Demand Slows for Old Navy Brand
Japan Orders Takata to Investigate Flawed Airbags
Ebola Becomes Latest Stock Scam, SEC Says
TV Streaming Service Aereo Files For Bankruptcy
Cullen Roche: 3 No-Brainer Policies Our Government Won’t Implement
Ben Carlson: Avoiding The Recency Bias in Foreign Stock Markets
Be sure to follow me on Twitter.
-
Ross Stores Beat Earnings
Posted by Eddy Elfenbein on November 20th, 2014 at 6:27 pmImpressive earnings report from Ross Stores ($ROST). The deep discounter earned 93 cents per share for its fiscal third quarter. That was six cents more than estimates.
The CEO said:
“We are pleased with the better-than-expected sales and earnings we achieved in the third quarter. These results were driven by our ongoing ability to deliver compelling bargains to our customers, which drove above-plan sales gains and strong merchandise gross margins. Operating margin for the quarter grew 55 basis points due to a 40 basis point improvement in cost of goods sold and a 15 basis point decline in selling, general and administrative expenses.”
Quarterly sales rose 8% to $2.599 billion. Same-stores sales were up by 4%.
For Q4, Ross projects earnings between $1.05 and $1.09 per share. For the entire year, they see earnings between $4.28 and $4.32 per share. That’s an increase of 10% to 11% over last year. The shares are up more than 5.5% after hours.
-
The S&P 500 Nears Its Inflation-Adjusted High
Posted by Eddy Elfenbein on November 20th, 2014 at 12:02 pmThe stock market is up a little bit this morning. Of course, the stock market seems to only move in little bits these days. Looking at our Buy List, Ross Stores ($ROST) reports after the close today, and retail stocks have perked up lately. Ross has been as high as $83.47 today and Bed Bath & Beyond has been up to $73.41. That’s a nice rebound.
One shocking econ report today came from the Philly Fed. The latest report on manufacturing activity in the Philadelphia Fed region came in at 40.8. That demolished expectations of 18.5. In fact, the beat was so big that I suspect there may be something off. As always with economic data, we want to wait for more confirmation before we can declare a new trend.
The Labor Department said that consumer inflation was flat last month. But if you take out food and energy, inflation was up by 0.2% in October. Inflation is up 1.664% in the last 12 months.
Speaking of inflation, the S&P 500 is still below its inflation-adjusted high from March 2000, but it’s closing in. Including dividends, the market has made an inflation-adjusted profit, but the straight index still has not.
Thanks to the latest CPI data, we can say that the S&P 500 would have to have been at 2,122.74 on October 31 to match its inflation-adjusted high. The problem is that there’s at least a three-week lag with inflation data, so it’s impossible to say exactly where the inflation-adjusted high is in real time.
But we can make some estimates. With an inflation rate of 1.7%, that means it nicks 0.1 points off the S&P 500 each calendar day. That would bring the current inflation-adjusted high to 2,124.75. Let’s say 2,125 to be safe. That means the stock market is about 3.5% away from a new inflation-adjusted high. This could happen soon.
-
How the Stock Market Performs Before and After Big Drops and Big Rallies
Posted by Eddy Elfenbein on November 20th, 2014 at 8:58 amLately, I’ve been doing some unusual projects with market data. Here’s the latest one I wanted to share with you.
I wanted to see if there’s a pattern the S&P 500 exhibits before and after major price moves. To do this, I took all of the S&P 500 daily changes since 1950. I then selected out all the days when the market fell by more than 2%, rose by more than 2% and everything else.
Historically, the market has risen by 2% or more in a single day, on average, once every two months. It’s nearly identical for 2% daily rallies. I then included how the market did on the 16 days prior to each big rise or fall, plus the subsequent 35 days.
The blue line shows that the stock market slides into a big drop, but rallies afterward.

What surprised me was the red line. It shows that the S&P 500 also slides into big jumps. In fact, the slide is a bit more pronounced than the blue line. Yet again, the market rallies after the big leap upward. The rally is slightly weaker than the blue line’s rally.
The black is all of the rest of the time, which is about 96% of the time. It barely moves. The rest of the time, the stock market gradually climbs.
I think this underscores an important point about financial markets. Markets tend to move between long periods of stability and short periods of great instability.
-
Morning News: November 20, 2014
Posted by Eddy Elfenbein on November 20th, 2014 at 7:06 amEurozone PMIs Slow, Raising Pressure on ECB
UK Retail Sales Rose by 0.8% in October as Prices Fell
Yen Under Pressure After 7-Year Dollar Low
Russia Has Little to Offer in Oil Price War
Crude Oil Edges Down as Eyes Fixed on OPEC Meeting
Fed Debate Shifts to Tightening Pace After First Rate Increase
Uber’s Terrible, Horrible, No Good, Very Bad Day
Alibaba Will Set Up International Version of Taobao Marketplace: Jack Ma
Qualcomm Wants to Move Out of Your Pocket Into Your Cars, House and Wearable
New Scrutiny of Goldman’s Ties to the New York Fed After a Leak
Banks Had Unfair Advantage From Commodity Units
Sanofi Ready to Emerge From Innovation Drought
Banking Culture Breeds Dishonesty, Scientific Study Finds
Jeff Carter: The Best Way to Talk About Your Company
Joshua Brown: Every Smart Beta Strategy Works, If You Can Be An Adult.
Be sure to follow me on Twitter.
-
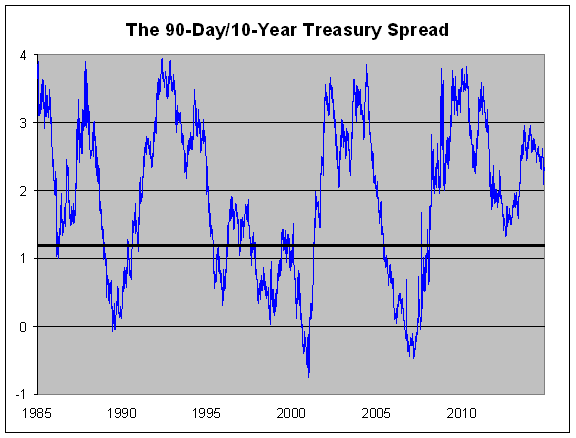
Equity Returns and the Yield Curve
Posted by Eddy Elfenbein on November 19th, 2014 at 10:21 amI did some research and found this fascinating stat. When the spread between the 90-day and 10-year Treasury yield is 121 basis points or more, the stock market does much better than when it’s 120 basis points or less.
Here’s how it works. Since 1962, the S&P 500 has averaged a 1.42% annualized gain when the yield spread is 120 points or less (that doesn’t include dividends). But it’s averaged 10.47% per year when the spread is 121 basis points or more. That’s a big difference.
Over the last 53 years, the spread has been 120 basis points or less about 41% of the time, and it’s been 121 basis points or more the other 59% of the time.
The spread has been over 121 points continuously for nearly seven straight years. In fact, the indicator’s only big miss came in early 2008 when it flashed bullish several months too early.
The yield spread is currently 230 basis points. If the 10-year yield stays at this level, then, according to our indicator, we don’t have to start worrying about stocks until the 90-day yield gets over 1%. It’s currently at 0.04%.
Here’s the spread over the last 30 years (the black line is at 120 basis points):
-
Archives
- June 2026
- May 2026
- April 2026
- March 2026
- February 2026
- January 2026
- December 2025
- November 2025
- October 2025
- September 2025
- August 2025
- July 2025
- June 2025
- May 2025
- April 2025
- March 2025
- February 2025
- January 2025
- December 2024
- November 2024
- October 2024
- September 2024
- August 2024
- July 2024
- June 2024
- May 2024
- April 2024
- March 2024
- February 2024
- January 2024
- December 2023
- November 2023
- October 2023
- September 2023
- August 2023
- July 2023
- June 2023
- May 2023
- April 2023
- March 2023
- February 2023
- January 2023
- December 2022
- November 2022
- October 2022
- September 2022
- August 2022
- July 2022
- June 2022
- May 2022
- April 2022
- March 2022
- February 2022
- January 2022
- December 2021
- November 2021
- October 2021
- September 2021
- August 2021
- July 2021
- June 2021
- May 2021
- April 2021
- March 2021
- February 2021
- January 2021
- December 2020
- November 2020
- October 2020
- September 2020
- August 2020
- July 2020
- June 2020
- May 2020
- April 2020
- March 2020
- February 2020
- January 2020
- December 2019
- November 2019
- October 2019
- September 2019
- August 2019
- July 2019
- June 2019
- May 2019
- April 2019
- March 2019
- February 2019
- January 2019
- December 2018
- November 2018
- October 2018
- September 2018
- August 2018
- July 2018
- June 2018
- May 2018
- April 2018
- March 2018
- February 2018
- January 2018
- December 2017
- November 2017
- October 2017
- September 2017
- August 2017
- July 2017
- June 2017
- May 2017
- April 2017
- March 2017
- February 2017
- January 2017
- December 2016
- November 2016
- October 2016
- September 2016
- August 2016
- July 2016
- June 2016
- May 2016
- April 2016
- March 2016
- February 2016
- January 2016
- December 2015
- November 2015
- October 2015
- September 2015
- August 2015
- July 2015
- June 2015
- May 2015
- April 2015
- March 2015
- February 2015
- January 2015
- December 2014
- November 2014
- October 2014
- September 2014
- August 2014
- July 2014
- June 2014
- May 2014
- April 2014
- March 2014
- February 2014
- January 2014
- December 2013
- November 2013
- October 2013
- September 2013
- August 2013
- July 2013
- June 2013
- May 2013
- April 2013
- March 2013
- February 2013
- January 2013
- December 2012
- November 2012
- October 2012
- September 2012
- August 2012
- July 2012
- June 2012
- May 2012
- April 2012
- March 2012
- February 2012
- January 2012
- December 2011
- November 2011
- October 2011
- September 2011
- August 2011
- July 2011
- June 2011
- May 2011
- April 2011
- March 2011
- February 2011
- January 2011
- December 2010
- November 2010
- October 2010
- September 2010
- August 2010
- July 2010
- June 2010
- May 2010
- April 2010
- March 2010
- February 2010
- January 2010
- December 2009
- November 2009
- October 2009
- September 2009
- August 2009
- July 2009
- June 2009
- May 2009
- April 2009
- March 2009
- February 2009
- January 2009
- December 2008
- November 2008
- October 2008
- September 2008
- August 2008
- July 2008
- June 2008
- May 2008
- April 2008
- March 2008
- February 2008
- January 2008
- December 2007
- November 2007
- October 2007
- September 2007
- August 2007
- July 2007
- June 2007
- May 2007
- April 2007
- March 2007
- February 2007
- January 2007
- December 2006
- November 2006
- October 2006
- September 2006
- August 2006
- July 2006
- June 2006
- May 2006
- April 2006
- March 2006
- February 2006
- January 2006
- December 2005
- November 2005
- October 2005
- September 2005
- August 2005
- July 2005
 Eddy Elfenbein is a Washington, DC-based speaker, portfolio manager and editor of the blog Crossing Wall Street. His