-
Deflation in November
Posted by Eddy Elfenbein on December 17th, 2014 at 9:08 amThis morning, the government reported that consumer prices fell 0.3% last month. The reason, of course, is the big plunge in energy prices.
The core rate, which excludes food and energy prices, comes in for a lot of ribbing but this is one of those times when it’s important. Food and energy prices can be very volatile and they may not reflect what’s really going on with most consumer prices. The core rate of inflation rose by just 0.1% in November.
-
Morning News: December 17, 2014
Posted by Eddy Elfenbein on December 17th, 2014 at 6:54 amIrish Lawmakers Open Probe Into Banking Crisis
Slowdown in China Bruises Economy in Latin America
Why Russia Is Destroying Its Own Economy
Gold Trades Above One-Week Low as Investors Weigh Fed to Russia
Bond Investors Are Skittish Over Emerging Markets
Diesel Deregulation, Gas Price to Have Positive Impact on Oil Companies
Fed Likely to Signal Rate Hike on Track Despite Global Woes
Gross Backs Krugman View of Fed on Hold in World of Lowflation
Uber CEO Says Company Wants to Make Rides Safer
Uber Says Only Some Employees Have Access to `God View’
Coolpad Announces Strategic Partnership with Qihoo 360
Oil Firms Supply Fuel to SpiceJet on Cash Payment
Joshua Brown: RIAs Will Take a Third of the Wealth Management Biz by 2018
Joshua Brown: Another Lying Paper Trader
Be sure to follow me on Twitter.
-
Express Scripts Reaffirms 2014 Guidance
Posted by Eddy Elfenbein on December 16th, 2014 at 9:30 amExpress Scripts ($ESRX) just released a statement saying their CFO Cathy R. Smith will be leaving soon. The company also reaffirmed their guidance for 2014. ESRX expects full-year EPS of $4.86 to $4.90. This is the same guidance they offered in October. At the time, ESRX narrowed it from the previous guidance of $4.84 to $4.92 per share. That translates to Q4 earnings of $1.36 to $1.40 per share.
-
The Ruble Crashes
Posted by Eddy Elfenbein on December 16th, 2014 at 8:51 amDespite the Russian Fed’s dramatic rate increase, the ruble’s fall continues. The Russian currency dropped another 20% today. That’s on top of the huge fall this year. This is getting out of hand. At one point, the ruble was going for 80 on the dollar.
The currency market seems especially concerned about a mysterious bond offering from Rosneft, a major Russian oil company. The company is run by one of Mr. Putin’s old buddies from the KGB.
It’s still not exactly clear what happened, but this is my best estimate. In effect, Rosneft is using the Russian Fed as their personal piggy bank.
What happened is that Rosneft went on a buying binge, snapping up smaller rivals. Now they’re in debt which they can’t rollover due to sanctions. So Rosneft floated a 625 billion ruble bond which was bought by…someone, we’re not sure who. It was most likely some of the major state banks. The banks then deposited the bonds at the CBR in exchange for loans. That’s one large indirect way of the CBR printing rubles and giving them to Rosneft. This news did not go down well.
This is what’s referred to as monetizing debt (printing currency to pay for debts). The hitch is that you’re not really paying anything off; you’re just displacing it. You’re going to pay one way or the other, and this time it was in the form of a much lower currency.
-
Morning News: December 16, 2014
Posted by Eddy Elfenbein on December 16th, 2014 at 7:36 amWeak Private Sector Growth Data Pushes Euro Zone Yields to New Lows
3 Banks Fall Short in Bank of England Stress Test
Ruble Continues Its Decline in Russia, Despite Interest Rate Increase
Dubai Stocks Lead Gulf Markets Lower as Oil’s Plunge Deepens
Shale Veteran Takes On Argentina’s $6 Billion Shortfall
When Will Short-Term Interest Rates Rise?
Will Low Oil Prices Affect The U.S. Fed’s Decisions?
U.S. Industrial Output Surpasses Prerecession Peak
Halal Beef Supplier Vows to Contest Fraud Charges
Repsol Agrees to Buy Canada’s Talisman for $8.3 Billion
Riverbed Technology Accepts $3.6 Billion Takeover Bid
Fallout for the S.E.C. and the Justice Dept. From the Insider Trading Ruling
Korean Air Facing Sanctions For Urging Employees to Lie About Nut-Rage Case
Cullen Roche: Can A Central Bank Always Create Inflation?
Jeff Carter: What’s A Position Limit?
Be sure to follow me on Twitter.
-
Russia Raises Rates 6.5%
Posted by Eddy Elfenbein on December 15th, 2014 at 10:39 pmIn last Friday’s CWS Market Review, I wrote:
The ruble is looking more like rubble. Russia estimates that inflation will hit 10% next year. The Russian Fed raised interest rates again this week, but the forex market just laughed at them. I don’t blame them. Despite a lot of talk, the Bank of Russia simply isn’t serious about defending the ruble. The BOR raised rates by 1% to 10.5%. Please. If they’re serious, they would have raised rates by 2% or 3%. That’s what needs to be done.
Someone must be listening to me. The Bank of Russia just announced that it’s raising interest rates to 17%. That’s a stunning increase of 6.5%. The increase was announced at 1 a.m. As a rule of thumb, anything done by a central bank in the middle of the night is probably bad news. It’s also probably very important.
Russia is in a classic situation that many countries have faced before. The international currency and bond markets have lost faith in the ruble. Every day it’s been attacked. Until now, Russia has attempted, rather weakly, to defend the indefensible ruble. The defense hasn’t been nearly adequate but they’ve finally taken a tough stand.
These currency wars are characterized by an odd feedback relationship. If the markets have faith in the government, then the crisis ends. If they don’t, the situation worsens and it thereby becomes more difficult for the government to do what needs to be done. It’s not so easy to turn a vicious cycle into a virtuous one. Nearly every government leader since the dawn of time has blamed a currency attack on “speculators,” though I’ll note that these evil speculators have an odd habit on ganging up on currencies that can’t withstand attacks. Funny, that.
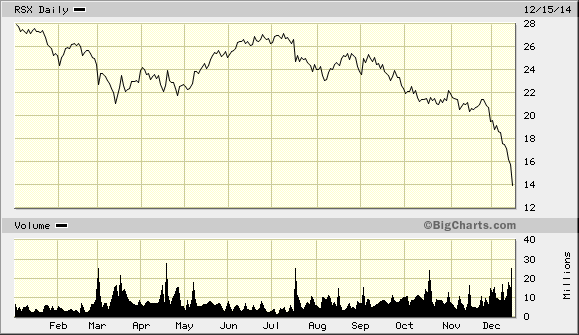
Russia is in much better shape than they were in 1998. During the crisis 16 years ago, Russia raised rates to 150%. Make no mistake: The big rate hike is a war on the shorts. Check out the amazing decline in the Russian ETF ($RSX). It’s lost 35% in the last three weeks.
-
The Pain in Junk Bonds
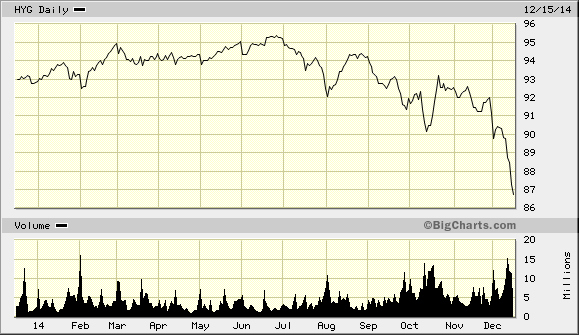
Posted by Eddy Elfenbein on December 15th, 2014 at 11:02 amThe junk bond market has been getting clobbered recently. The chart below shows the recent plunge in the Junk Bond ETF ($HYG) The sell-off is partly a spillover from lower oil prices since many energy companies have floated low-rated bonds. Last week was the worst week for junk bonds in three years.
The weakness in junk isn’t necessarily a harbinger of bad times, but it’s an important development. It’s basically a broad reassessment of risk. Investors are now demanding a greater premium to own riskier bonds.
For an economy to show a broad recovery, I would expect to see marginal borrowers do well, but that’s not a given. The WSJ notes that, “Junk bonds now trade at a yield of 5.28 percentage points above yields of comparable U.S. Treasurys, up from 3.23 points at their June low for the year.”
-
Strongest Industrial Production since May 2010
Posted by Eddy Elfenbein on December 15th, 2014 at 10:01 amLast week was the worst for the S&P 500 in two-and-a-half years. For the Dow, it was its worst week in more than three years. The market may also be getting more volatile. The high for the VIX on Friday was more than twice its low from the previous Friday. Fortunately, stocks are holding on to modest gains this morning.
One hopeful sign is that Prime Minister Shinzo Abe of Japan won a big reelection victory yesterday. That ought to give him a mandate to continue with his economic reforms which have included a dramatically lower yen. The yen has dropped from 101 to the dollar in July to 121 per dollar last week. Japan hasn’t had much good economic news in a long time.
On a related note, the amazing drop in oil continues. On Friday, West Texas Intermediate got as low as $57.34 per barrel. That’s the lowest price since May 2009. For some context, in the summer of 2008, oil was going for more than $140 per barrel.
The big econ report this morning showed that Industrial Production rose by 1.3% last month. That’s the biggest jump since May 2010 (see below). The report also showed the biggest gain in consumer production in 16 years. The theme is the same—the U.S. economy is improving, but very slowly.
The Federal Reserve meets on Tuesday and Wednesday of this week. This meeting will be followed by a Yellen presser plus updates on the Fed’s projections (better known as the blue dots). I actually think this meeting won’t be so important. We know rates are going higher, but we don’t know when.
There might be some nervousness this morning as the terrible hostage drama plays out in Australia. I also noticed that PetSmart ($PETM) is up this morning on the news that it’s being bought out for $83 per share. That’s 16.7 times estimated earnings for next fiscal year (ending in January 2016). I’ve often kept an eye on PETM and considered it for previous Buy Lists. I am a little surprised by how low the premium is. It’s less than 7% above Friday’s close.
Oracle ($ORCL) is up strongly this morning thanks to an upgrade at Morgan Stanley. Although it’s odd to upgrade a stock that’s going to report earnings on Wednesday.
-
Morning News: December 15, 2014
Posted by Eddy Elfenbein on December 15th, 2014 at 7:00 amBOJ Survey Shows Japan Business Mood Fragile, Highlights Abe’s Challenges
Bundesbank Backs ECB Line on Possible Further Measures
India’s Wholesale Inflation at Lowest in Over Five Years
Oil Jumps Most in Two Weeks as Fighting, Strike Curb OPEC Output
U.A.E. Sees OPEC Output Unchanged Even If Oil Drops to $40
Airlines Charging Sky-High Prices as Oil Costs Plummet
Paris Taxis Block Highway to Urge Ban on Uber Cabs
Uber Briefly Quadruples Prices For Rides Out of Hostage-Crisis Sydney
PetSmart to Sell Itself to Investor Group for $8.7 Billion
Emerson to Sell Power Transmission Unit for $1.4 Billion
Shunning Apple Tops Long List of Bad Market Calls in 2014
Sony Pictures Demands That News Agencies Delete ‘Stolen’ Data
Roger Nusbaum: Grandma Got Run Over By A Dividend Portfolio
Jeff Miller: Weighing the Week Ahead: Will Crashing Oil Prices Change the Fed’s Course?
Be sure to follow me on Twitter.
-
Apple’s IPO: 34 Years Ago Today
Posted by Eddy Elfenbein on December 12th, 2014 at 9:52 amThirty four years ago today, Apple Computer ($AAPL) went public. Today, the company is officially just Apple Inc. The offering was for $22 per share. Since then, Apple has split four times; three times 2-for-1 and once 7-for-1. That adds up to 56-for-1 which means the $22 offering is 39.3 cents split adjusted.
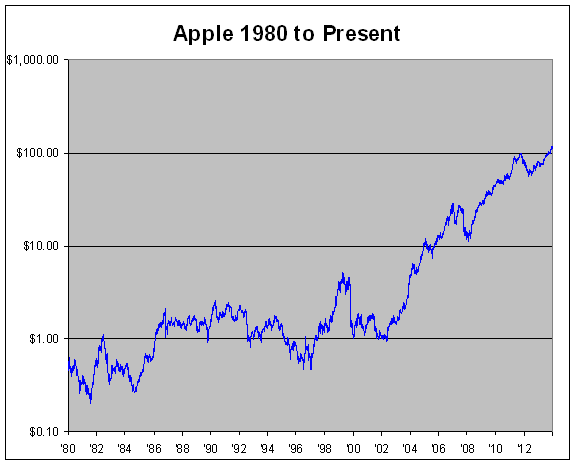
This may sound surprising, but Apple wasn’t a hit. By mid-1982, the shares were going for half the offering price. The stock did have its moment in the sun: In the 26 months prior to the 1987 crash, shares of Apple rose eight-fold.
But overall, Apple was not a hot stock. At its low point in 2003, Apple was lower than where it had been in 1983. Think about that! Twenty years of no gain, and this was well after Steve Jobs had returned.
But in 2003, Apple started one of the most amazing rallies in Wall Street history. In less than ten years, the stock jumped more than 100-fold. To be precise, Apple rose 107-fold (10,603%) in nine years and five months. That includes a brutal 60% drop during the Financial Crisis.
Apple gained back what it lost but suffered another painful correction. From September 2012 to April 2013, Apple shed 44%. That was when we heard the refrain, “Apple doesn’t know how to innovate anymore.” Once again, Apple made back everything it had lost.
Now here are some numbers. Measuring from the offering price 34 years ago, Apple has gained 28,412%. Annualized, that’s 18.1%.
Apple’s single-worst day came on September 29, 2000 when the stock plunged 51.9%. The catalyst was that Apple said they were going to miss earnings. That was also Apple’s highest volume day. It traded over 1.8 billion shares that day.
Apple has suffered other big drops. On the day of the 1987 crash, Apple fell 24.4%. The stock has fallen more than 10% in a single day 26 times, which is nearly once per year.
Apple’s single-best day came on August 6, 1997 when it soared 33.2%. That was the day Steve Jobs announced at a MacWorld trade show that Microsoft was investing $150 million in Apple preferred stock. That moved saved Apple. At the time, people in the crowd booed. Here’s a story from the Seattle Times about the announcement.
A lot of people forget that Apple used to pay a dividend many years ago. They introduced a small quarterly dividend in 1987. Apple raised it four times, and then kept it the same for five years until it expired in 1995. Two years ago, Apple resumed paying a dividend. The current quarterly dividend is 47 cents per share which is a 120% return on the IPO price.
When Apple was founded on April 1, 1976, there were three founders; Steve Wozniak, Steve Jobs and Ronald Wayne. On April 11, Wayne sold his 10% back to the Steves for $800. Apple’s current market value is $655 billion making it the most valuable company in the world.
-
Archives
- September 2026
- August 2026
- July 2026
- June 2026
- May 2026
- April 2026
- March 2026
- February 2026
- January 2026
- December 2025
- November 2025
- October 2025
- September 2025
- August 2025
- July 2025
- June 2025
- May 2025
- April 2025
- March 2025
- February 2025
- January 2025
- December 2024
- November 2024
- October 2024
- September 2024
- August 2024
- July 2024
- June 2024
- May 2024
- April 2024
- March 2024
- February 2024
- January 2024
- December 2023
- November 2023
- October 2023
- September 2023
- August 2023
- July 2023
- June 2023
- May 2023
- April 2023
- March 2023
- February 2023
- January 2023
- December 2022
- November 2022
- October 2022
- September 2022
- August 2022
- July 2022
- June 2022
- May 2022
- April 2022
- March 2022
- February 2022
- January 2022
- December 2021
- November 2021
- October 2021
- September 2021
- August 2021
- July 2021
- June 2021
- May 2021
- April 2021
- March 2021
- February 2021
- January 2021
- December 2020
- November 2020
- October 2020
- September 2020
- August 2020
- July 2020
- June 2020
- May 2020
- April 2020
- March 2020
- February 2020
- January 2020
- December 2019
- November 2019
- October 2019
- September 2019
- August 2019
- July 2019
- June 2019
- May 2019
- April 2019
- March 2019
- February 2019
- January 2019
- December 2018
- November 2018
- October 2018
- September 2018
- August 2018
- July 2018
- June 2018
- May 2018
- April 2018
- March 2018
- February 2018
- January 2018
- December 2017
- November 2017
- October 2017
- September 2017
- August 2017
- July 2017
- June 2017
- May 2017
- April 2017
- March 2017
- February 2017
- January 2017
- December 2016
- November 2016
- October 2016
- September 2016
- August 2016
- July 2016
- June 2016
- May 2016
- April 2016
- March 2016
- February 2016
- January 2016
- December 2015
- November 2015
- October 2015
- September 2015
- August 2015
- July 2015
- June 2015
- May 2015
- April 2015
- March 2015
- February 2015
- January 2015
- December 2014
- November 2014
- October 2014
- September 2014
- August 2014
- July 2014
- June 2014
- May 2014
- April 2014
- March 2014
- February 2014
- January 2014
- December 2013
- November 2013
- October 2013
- September 2013
- August 2013
- July 2013
- June 2013
- May 2013
- April 2013
- March 2013
- February 2013
- January 2013
- December 2012
- November 2012
- October 2012
- September 2012
- August 2012
- July 2012
- June 2012
- May 2012
- April 2012
- March 2012
- February 2012
- January 2012
- December 2011
- November 2011
- October 2011
- September 2011
- August 2011
- July 2011
- June 2011
- May 2011
- April 2011
- March 2011
- February 2011
- January 2011
- December 2010
- November 2010
- October 2010
- September 2010
- August 2010
- July 2010
- June 2010
- May 2010
- April 2010
- March 2010
- February 2010
- January 2010
- December 2009
- November 2009
- October 2009
- September 2009
- August 2009
- July 2009
- June 2009
- May 2009
- April 2009
- March 2009
- February 2009
- January 2009
- December 2008
- November 2008
- October 2008
- September 2008
- August 2008
- July 2008
- June 2008
- May 2008
- April 2008
- March 2008
- February 2008
- January 2008
- December 2007
- November 2007
- October 2007
- September 2007
- August 2007
- July 2007
- June 2007
- May 2007
- April 2007
- March 2007
- February 2007
- January 2007
- December 2006
- November 2006
- October 2006
- September 2006
- August 2006
- July 2006
- June 2006
- May 2006
- April 2006
- March 2006
- February 2006
- January 2006
- December 2005
- November 2005
- October 2005
- September 2005
- August 2005
- July 2005
 Eddy Elfenbein is a Washington, DC-based speaker, portfolio manager and editor of the blog Crossing Wall Street. His