-
Morning News: October 15, 2014
Posted by Eddy Elfenbein on October 15th, 2014 at 6:50 amGerman Bond Yields Drop to Records on Economy; Greek Debt Slides
Fall in UK Unemployment: What The Economists Say
Ireland to Close ‘Double Irish’ Tax Loophole
Fed Is Silent on Doomsday Book, a Blueprint for Fighting Crises
Refinance Boomlet Gives U.S. Banks Relief From Plunge
JPMorgan’s Profit Misses; Posts Unexpected $1 Billion Legal Expense
Qualcomm to Buy U.K. Chipmaker CSR in $2.5 Billion Deal
AbbVie to Reconsider Inversion Deal for Shire
Toyota Recalls 1.67 Million Vehicles
Citigroup Consumer Chief Plans to Leave
Intel Gives Rosy Fourth-Quarter Revenue Forecast as PCs Recover
IndiGo Signs Deal for Airbus A-320neo Aircraft
How Jean Tirole’s Work Helps Explain the Internet Economy
Jean Tirole’s Nobel Prize Is Also a Win for Modern Microeconomic Theory
Jeff Carter: Ebola Helping the Market Break
Joshua Brown: How We Think About ETFs
Be sure to follow me on Twitter.
-
Wells Fargo Earns $1.02 per Share
Posted by Eddy Elfenbein on October 14th, 2014 at 8:15 amFor Q3, Wells Fargo ($WFC) reports earnings of $1.02 per share which matched expectations.
SAN FRANCISCO (AP) _ Wells Fargo & Co. (WFC) on Tuesday reported third-quarter profit of $5.41 billion.
The San Francisco-based bank said it had earnings of $1.02 per share.
The results met Wall Street expectations. The average estimate of analysts surveyed by Zacks Investment Research was also for earnings of $1.02 per share.
The biggest U.S. mortgage lender posted revenue of $21.21 billion in the period, topping Street forecasts. Analysts expected $20.95 billion, according to Zacks.
Wells Fargo shares have risen 11 percent since the beginning of the year, while the Standard & Poor’s 500 index has climbed slightly more than 1 percent. The stock has increased 21 percent in the last 12 months.
-
Yes, the 200-DMA Works
Posted by Eddy Elfenbein on October 14th, 2014 at 7:56 amI’m generally not much of a follower of technical analysis, but I don’t dismiss it either. In particular, I like to look at the 200-day moving average. So it was big news for me when the S&P 500 finally closed below its 200-DMA yesterday. That hadn’t happened in nearly two years. This was the second-longest streak in the last 58 years. We came about three months shy of tying the July 1996 to August 1998 streak.
I’ve looked at the historical data, and the 200-DMA has a decent track record. When the S&P 500 is above the 200-DMA, the market does well. When it’s below the 200-DMA, it does poorly. Not very complicated.
Since the beginning of 1933 to yesterday, the S&P 500 has traded above its 200-DMA 67.8% of the time. It’s traded below the 200-DMA the other 32.2% of the time. When the S&P 500 is above its 200-DMA, it’s risen by an annualized rate of 11.29%. But when it’s below the 200-DMA, it’s fallen at an annualized rate of -1.06%.
(Technical note: For consistency, I excluded Saturday trading which lasted until 1952. For the annualized numbers, I assumed a year of 253 trading days.)
Why is this so? I think this is a good example of a dumb rule that works for complex reasons. The complexity part is that the stock market does show momentum. Changes in the market are not normally distributed. Good times tend to lead to good times. Bad times lead to more bad times. The hard part, of course, is spotting when the trends change. The 200-DMA is about the sweet spot in that it’s long enough to capture the trend, but short enough to pick up on reversals. The more dramatic the reversal, the quicker the 200-DMA will flag it.
-
The Buy List Suddenly Wakes Up
Posted by Eddy Elfenbein on October 13th, 2014 at 10:01 pmOur Buy List has been lagging the S&P 500 for much of this year, and it seems as if our seven-year market-beating streak is in jeopardy.
The market’s recent downturn, however, has been good for our Buy List. Or more accurately, we’re down but not as much as the overall market.
Our goal, of course, is to make money, not to suck less than everyone else. Since September 29, the S&P 500 is down 5.21% while our Buy List is down 2.77%. That’s a significant margin considering how broadly diversified our Buy List is. Consider that the correlation of daily changes between our Buy List and the S&P 500 is more than 93%. Being down half as much is not normal. Our “beta” usually runs about 0.95.
What happened is that when people get nervous, they don’t abandon the high-quality names on our Buy List as rapidly as they do for less-stable stocks.
For the year so far, our Buy List is down 1.01% while the S&P 500 is up 1.43%. If the trend of the last two weeks continues, we may close the gap even further.
-
The S&P 500 Closes Below Its 200-DMA
Posted by Eddy Elfenbein on October 13th, 2014 at 6:07 pmToday was an unpleasant day for the stock market. The S&P 500 dropped 1.65% to close at 1,874.74. This was the worst three-day slide in three years. This is also the first time in nearly two years that the index has closed below its 200-day moving average. Historically, the stock market has performed much better when it’s above the 200-DMA than it has when it’s below it. This was the S&P 500’s lowest close since May 20. All told, the index is now 6.8% below its BABA high.
Shortly after 2 pm, the market was flat for the day, but then things fell apart, especially in the final trading hour of the day. The price of oil fell to a four-year low. With that, shares of energy stocks felt more pain. The dollar fell and gold rallied. Airline stocks have been getting clobbered which is probably related to Ebola fears. The VIX exploded 16% today to close at 24.64.
Bloomberg notes that futures prices indicate that there’s now a 46% chance the Fed will raise rates by their September 2015 meeting. That’s down from 55% on October 10. The price of oil fell today to $88.89 per barrel. That’s the lowest since November 2010. At least the bond market wasn’t harmed as it was closed today for Columbus Day.
Here’s a minute-by-minute chart of today’s market:
Here’s a look at airline stocks compared with the S&P 500:
-
Let’s Make Our Own Hypothetical Stock Market
Posted by Eddy Elfenbein on October 13th, 2014 at 12:23 pmOne of the points I stress to investors is just how much noise there is in everyday trading. Simply put, the stock market moves around a heckuva lot compared with what value is actually being created.
I ran the numbers going back to 1957 and found that the S&P 500’s average daily gain works out to 0.0255%. Roughly speaking, that means for every $39 you have in the stock market, you make an average of one penny in capital gains each trading day. Snoozeville, right?
Yet the average daily swing is about 40 cents. This means that you’re seeing 40 times the volatility of the value that’s actually being created, each day. That’s more than 97% noise.
We can use some basic math and a random number function to create our own hypothetical stock market. I’ve attached a spreadsheet which contains our phony market.
I’ve used the calendar for the 2013 trading year as our template. It contains 252 trading days. I’ve set our index to 100 at the start of the year. Each day, the index gains an average of 0.0255%. The random number generator gives us a standard deviation of 1%.
(This is not quite accurate due to the nature of fat tails. I ask the more numerate among us to leave that issue aside for now, since it doesn’t detract from my point. In fact, it supports it.)
Once you’ve downloaded the spreadsheet (and assuming I’ve done this correctly), you can simply point your cursor to an empty cell and keep hitting “delete,” and the chart I’ve made should refresh. Here’s the point: You can just see how many wildly different stock markets we can make solely on the basis of random numbers.
There’s no trend or QE or anything going on. It’s just random, but it’s based on the market’s same stats of the last 56 years.
-
Entire Darden Board Voted Out
Posted by Eddy Elfenbein on October 13th, 2014 at 12:22 pmStarboard Value won a big victory for investors. Their slate of candidates completely swept out the current board of Darden Restaurants ($DRI).
The election of Starboard’s 12-director slate, announced Friday at Darden’s annual meeting, was a feather in the cap for the New York hedge fund, Darden’s second-largest investor with an 8.8 percent stake.
It was a stinging defeat for Darden, which this year alienated investors by brushing off their vote requesting a special meeting to debate the company’s then-proposed sale of its struggling Red Lobster chain.
The “extraordinary” and “totally self-inflicted” loss for Darden comes as no surprise given Darden’s “tone deafness” to investor wishes regarding the Red Lobster sale, said Charles Elson, director of the Weinberg Center for Corporate Governance in Delaware.
“It was kind of a done deal, wasn’t it?” agreed Karl Sooder, a Darden investor and University of Central Florida marketing professor, who attended Darden’s annual meeting in Orlando.
The board sweep, which is based on a preliminary vote count, is notable because of Darden’s size, experts said. Darden is the largest U.S. operator of full-service restaurants with $8.55 billion in 2013 sales.
I don’t have a dog in this fight, but I’m glad to see boards get fired. This should happen much more often.
-
The S&P 500 Breaks Its 200-DMA
Posted by Eddy Elfenbein on October 13th, 2014 at 10:19 amFor the first time in nearly two years, the S&P 500 broke below its 200-day moving average this morning. The index also dipped below 1,900. On Friday, we closed just above the 200-DMA.
-
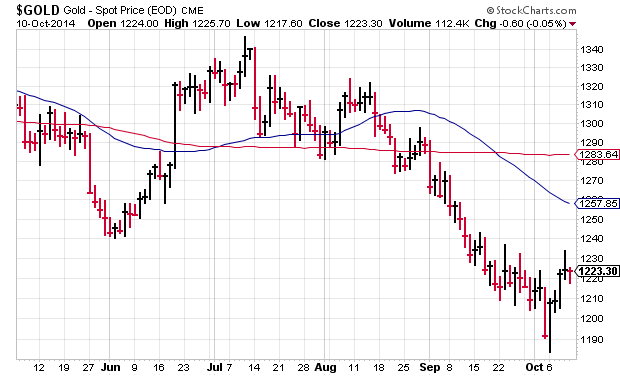
The Strong Dollar Trade
Posted by Eddy Elfenbein on October 13th, 2014 at 8:21 amRecently, I’ve talked a lot about the Strong Dollar Trade. I wanted to show you exactly what I meant by using a series of charts.
First off, here’s the soaring dollar index:
The strong dollar has caused commodities to tumble:
And that includes gold:
Lower commodity prices have hurt energy stocks:
Yet Consumer Staples haven’t budged:
Long-term Treasury yields have fallen:
The shift in the market has caused greater volatility:
Notice the gradual increase in the spread between the daily high and low.
Small-cap stocks have felt most of the pain:
-
Morning News: October 13, 2014
Posted by Eddy Elfenbein on October 13th, 2014 at 6:53 amDraghi Asset Plan Seen Falling Short as QE Bets Rise
Dollar Drops as Fed Officials Warn on Slowing Growth; Yen Gains
I.M.F. Warns of Global Financial Risk From Fiscal Policies
Finland Loses One of Euro Zone’s Last Top Credit Ratings
China Posts Strong Trade Figures, But Data Deserve Close Scrutiny
Growth Slows in China Passenger Vehicle Sales
Fed Vice Chairman Confident Regarding Next Move
Crude Oil May Not Fall Below $80 Per Barrel; Are OMCs a Blind Buy?
Russia Spending $6 Billion Not Enough to Stop Ruble Rout on Oil
Norway’s Statoil Sells Stake in Caspian Sea Oil Field for $2.25 Billion
Synergy Health Agrees To $1.9 Billion US Takeover
Marissa Mayer Faces Investor Revolt at Critical Time For Yahoo
Fiat Chrysler Crowns Merger With Wall Street Debut
Epicurean Dealmaker: The Privy Counselor
Be sure to follow me on Twitter.
-
Archives
- June 2026
- May 2026
- April 2026
- March 2026
- February 2026
- January 2026
- December 2025
- November 2025
- October 2025
- September 2025
- August 2025
- July 2025
- June 2025
- May 2025
- April 2025
- March 2025
- February 2025
- January 2025
- December 2024
- November 2024
- October 2024
- September 2024
- August 2024
- July 2024
- June 2024
- May 2024
- April 2024
- March 2024
- February 2024
- January 2024
- December 2023
- November 2023
- October 2023
- September 2023
- August 2023
- July 2023
- June 2023
- May 2023
- April 2023
- March 2023
- February 2023
- January 2023
- December 2022
- November 2022
- October 2022
- September 2022
- August 2022
- July 2022
- June 2022
- May 2022
- April 2022
- March 2022
- February 2022
- January 2022
- December 2021
- November 2021
- October 2021
- September 2021
- August 2021
- July 2021
- June 2021
- May 2021
- April 2021
- March 2021
- February 2021
- January 2021
- December 2020
- November 2020
- October 2020
- September 2020
- August 2020
- July 2020
- June 2020
- May 2020
- April 2020
- March 2020
- February 2020
- January 2020
- December 2019
- November 2019
- October 2019
- September 2019
- August 2019
- July 2019
- June 2019
- May 2019
- April 2019
- March 2019
- February 2019
- January 2019
- December 2018
- November 2018
- October 2018
- September 2018
- August 2018
- July 2018
- June 2018
- May 2018
- April 2018
- March 2018
- February 2018
- January 2018
- December 2017
- November 2017
- October 2017
- September 2017
- August 2017
- July 2017
- June 2017
- May 2017
- April 2017
- March 2017
- February 2017
- January 2017
- December 2016
- November 2016
- October 2016
- September 2016
- August 2016
- July 2016
- June 2016
- May 2016
- April 2016
- March 2016
- February 2016
- January 2016
- December 2015
- November 2015
- October 2015
- September 2015
- August 2015
- July 2015
- June 2015
- May 2015
- April 2015
- March 2015
- February 2015
- January 2015
- December 2014
- November 2014
- October 2014
- September 2014
- August 2014
- July 2014
- June 2014
- May 2014
- April 2014
- March 2014
- February 2014
- January 2014
- December 2013
- November 2013
- October 2013
- September 2013
- August 2013
- July 2013
- June 2013
- May 2013
- April 2013
- March 2013
- February 2013
- January 2013
- December 2012
- November 2012
- October 2012
- September 2012
- August 2012
- July 2012
- June 2012
- May 2012
- April 2012
- March 2012
- February 2012
- January 2012
- December 2011
- November 2011
- October 2011
- September 2011
- August 2011
- July 2011
- June 2011
- May 2011
- April 2011
- March 2011
- February 2011
- January 2011
- December 2010
- November 2010
- October 2010
- September 2010
- August 2010
- July 2010
- June 2010
- May 2010
- April 2010
- March 2010
- February 2010
- January 2010
- December 2009
- November 2009
- October 2009
- September 2009
- August 2009
- July 2009
- June 2009
- May 2009
- April 2009
- March 2009
- February 2009
- January 2009
- December 2008
- November 2008
- October 2008
- September 2008
- August 2008
- July 2008
- June 2008
- May 2008
- April 2008
- March 2008
- February 2008
- January 2008
- December 2007
- November 2007
- October 2007
- September 2007
- August 2007
- July 2007
- June 2007
- May 2007
- April 2007
- March 2007
- February 2007
- January 2007
- December 2006
- November 2006
- October 2006
- September 2006
- August 2006
- July 2006
- June 2006
- May 2006
- April 2006
- March 2006
- February 2006
- January 2006
- December 2005
- November 2005
- October 2005
- September 2005
- August 2005
- July 2005
 Eddy Elfenbein is a Washington, DC-based speaker, portfolio manager and editor of the blog Crossing Wall Street. His