-
The S&P 500 Set to Music
Posted by Eddy Elfenbein on January 21st, 2014 at 9:56 amLast year’s market set to music. Good beat, kinda hard to dance to:
-
The Piotroski Nine-Point Test
Posted by Eddy Elfenbein on January 21st, 2014 at 7:36 amI’m not a big fan of stock screens but I admire the work of Joseph Piotroski.
Dr. Piotroski is an accounting professor at Stanford. In 2000, he wrote an academic paper, “Value Investing: The Use of Historical Financial Statement Information to Separate Winners from Losers.”
Basically, he wanted to find what works with value investing. His strategy was to first find stocks with low valuations, then sort what cheap stocks would likely rebound.
Here’s the secret formula. Piotroski first takes stocks that have the lowest Price/Book Ratios. Then the stock has to pass eight of the following nine tests:
*The return on assets for the last fiscal year is positive.
*Cash from operations for the last fiscal year is positive.
*The return on assets ratio for the last fiscal year is greater than the return on assets ratio for the fiscal year two years ago.
*Cash from operations for the last fiscal year is greater than income after taxes for the last fiscal year.
*The long-term debt-to-assets ratio for the last fiscal year is less than the long-term debt to assets ratio for the fiscal year two years ago.
*The current ratio for the last fiscal year is greater than the current ratio for the fiscal year two years ago.
*The average shares outstanding for the last fiscal year is less than or equal to the average number of shares outstanding for the fiscal year two years ago.
*The gross margin for the last fiscal year is greater than the gross margin for the fiscal year two years ago.
*The asset turnover for the last fiscal year is greater than the asset turnover for the fiscal year two years ago.According to Forbes, the system has worked very well.
A stock screen run by the AAII based on Piotroski’s approach has a 10-year return of 32.5%, compared to a return of 5.5% for the S&P 500 during that same period. The 5-year return is better, at 40%, compared to 5.9% for the S&P. Year-to-date through the end of July, the Piotroski screen is up an amazing 105.7% versus 18.2% for the S&P.
-
Morning News: January 21, 2014
Posted by Eddy Elfenbein on January 21st, 2014 at 6:37 am‘Rich Kids of Beverly Hills’ Has a Message For Davos Leaders
German Economic Expectations Fall Slightly
Deutsche Loss Underlines European Economy’s Dependence on Banks
Korea’s Biggest Card-Data Theft Prompts Executives to Resign
China Workforce Slide Robs Xi of Growth Engine
Iran Viable Investment With 29% in Poll as Rouhani Visits Davos
CEO Profit Skepticism Backs Decade’s Weakest Stocks Estimate
China CNR Plans US $1.5 Billion HK IPO in 2nd Quarter
Overstock.com Sees New Market in Bitcoins
Unilever Beats Forecasts as Emerging Markets Rebound
SABMiller Third-Quarter Lager Sales Rise Less Than Estimated
SAP Delays Profitability Target Amid Cloud Push
Remy Cointreau’s China Woes Continue
Credit Writedowns: Bank Reserves and the Falling Loan to Deposit Ratio at US Banks
Jeff Carter: Milton Friedman Predicts Bitcoin
Be sure to follow me on Twitter.
-
The Mystery of 21 Points
Posted by Eddy Elfenbein on January 21st, 2014 at 12:42 amRecently, I’ve been wrestling with a math/sports puzzle and I wanted to share my thoughts with you. The puzzle began when I saw two charts by Seth Kadish of Vizual Statistix. One is a “heat map” and the other a histogram of points scored in every single NFL football game going back to 1920.
The histogram shows pretty much what you’d expect—the more points a team scores, the more likely they are to win the game. But I noticed an exception. There was something odd about teams that scored exactly 21 points.
Since 1940, teams that have scored exactly 20 points have gone 831-753-36 for a winning percentage of 0.524. But for teams that have scored 21 points, that record falls to 557-765-28, which is a winning percentage of 0.423.
Why does one more point translate into worse performance? I couldn’t get this out of my head. Were teams that scored 21 points just unlucky? Couldn’t be…the sample is just too large.
This riddle brought out my best and worst qualities. I love a good puzzle and I’m stubborn as hell. After giving this a lot of thought, I’ve come up with an answer. Let me share that with you.
The reason why 21 is so unlucky is that teams scoring 21 on the nose most likely haven’t kicked any field goals.
Think about it. While field goals aren’t that valuable by themselves, they’re the preferred instrument teams use to win close games. The teams who’ve scored 21 most likely haven’t used one.
As a result, we have a bit of a statistical illusion. Kicking lots of field goals won’t give you lots of wins, but winning games, particularly close ones, means you’ve probably kicked some field goals. (By the way, overtime isn’t a factor. We see the same effect on 21-pointers before 1974 when the NFL didn’t have overtime.) Conversely, this field goal effect also gives a nice bump to the 20-pointers with their numerous 20-17 victories. That’s the most-common football score.
This brings up an important fact about football. The object isn’t to score as many points as possible. Rather, it’s to score more points than the other team. That’s a subtle but important distinction when looking at the data. If a team is trailing by one or two points, or the score is tied, and they have the ball within field goal range, they’ll forgo trying to score a touchdown. They’ll try to burn as much time as they can, and go for the game-winning field goal as time expires.
When we look at the histogram we can see that there are a large number of games settled by three points (17-14, 20-17, 27-24). We can confirm our FG hypothesis by looking at 28 pointers, which is another candidate for few field goals. Teams that have scored 28 points on the nose have gone 622-281-30. Not bad, but it’s still below the 23 pointers at 658-280-8.
So how does this relate to finance (you knew where I was going with this, didn’t you?) The issue I’m raising isn’t about football. Rather, it’s about how we interpret data. Sometimes the numbers can fool us and we have to be clear what we’re looking for.
The similarity between finance and football is that the numbers are aware of themselves. This is very different from an experiment in the physical sciences. Boron doesn’t know it’s boron but the participants in a football know exactly what the score is and that they’re trying to win. As a result, statistics like standard deviation and the normal distribution are hindered.
Likewise, market participants know what the market is doing and the score of that game impacts their decisions. That’s why we see daily changes in the Dow far, far outside what a normal distribution would predict (in other words, fat tails).
One of the constant dangers of finance is the desire to quantify things that are either resistant to it, or simply not needed. The numbers are a picture of reality, not reality itself.
-
MLK Quote
Posted by Eddy Elfenbein on January 20th, 2014 at 8:20 amDr. Martin Luther King Jr. was born 85 years ago last Wednesday. One of my favorite MLK quotes is:
If a man is called to be a street sweeper, he should sweep streets even as Michaelangelo painted, or Beethoven composed music or Shakespeare wrote poetry. He should sweep streets so well that all the hosts of heaven and earth will pause to say, ‘Here lived a great street sweeper who did his job well.
I think the quote may have been influenced by Ecclesiastes 9:10.
-
Morning News: January 20, 2014
Posted by Eddy Elfenbein on January 20th, 2014 at 6:38 amThe Five Most Important Questions For The Davos Elite
What Lies Beneath China’s Growth
China Rate Swaps Drop as PBOC Injects Cash Before Lunar New Year
Malaysia Relaxes Rules For Auto Makers, Opening Industry To Energy-Efficient Foreign Producers
Bitcoin Judged Commodity in Finland After Failing Money Test
Deutsche Bank Posts Surprise Net Loss
AB InBev to Regain Grip on S. Korean Brewer OB for $5.8 billion
Shell Announces Sale of Wheatstone LNG Stake in Australia
CNOOC Limited Announces its 2014 Business Strategy and Development Plan
Peugeot Board Said to Approve Capital Increase Plan
Wells Fargo, US Bank And Fifth Third Plan To Close Payday Loan Program
Amazon Wants to Send You Stuff Before You’ve Even Decided to Buy It
Building Toward the Home of Tomorrow
Jeff Miller: Weighing the Week Ahead: More “Experts” Predicting a Market Top
Howard Lindzon: Clicks over Bricks…Long Live E-Commerce and Death to Best Buy…Even Movie Theatres
Be sure to follow me on Twitter.
-
December Industrial Production = +0.3%
Posted by Eddy Elfenbein on January 17th, 2014 at 10:31 amThe Federal Reserve reported that Industrial Production rose 0.3% last month. In November, the index became the latest to eclipse its pre-recession peak.
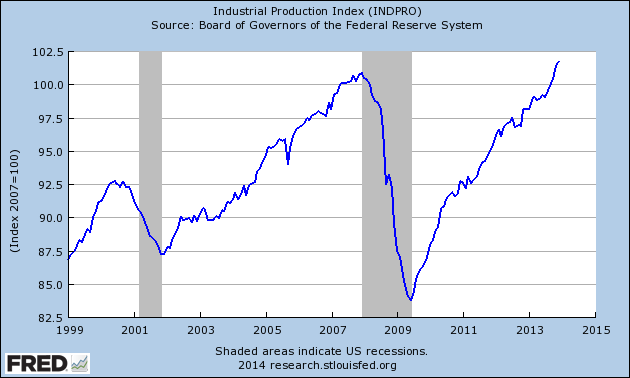
In six years, IP has risen by 0.9%.
-
CWS Market Review – January 17, 2014
Posted by Eddy Elfenbein on January 17th, 2014 at 7:12 am“It is not the crook in modern business that we fear, but the honest
man who doesn’t know what he is doing.” – Owen D. YoungEarnings season is finally here. We’ve already had one good earnings report from Wells Fargo ($WFC). The big bank beat earnings by two cents per share, and after a delayed reaction, the shares broke out to a new 52-week high. This week, I’m raising my buy below on WFC (more on that in a bit).
Things are about to get very busy for our Buy List. Next week, we’re due to have six earnings reports including heavyweights like IBM, McDonald’s and Microsoft. In this week’s CWS Market Review, I’ll preview our upcoming earnings, and I’ll break down the results from Wells Fargo.
Looking at this earnings season, the consensus on Wall Street is that earnings rose 4.9% last quarter. That’s kind of blah, but going into this earnings season, there were some serious concerns. Before earnings season even started, there were 95 earnings warnings in the S&P 500, compared with just 15 good-news surprises. But most of those warnings have been about rather minor adjustments. Actually, the market seems unusually sedate. A few times this week, the Volatility Index ($VIX) dropped below 12, which brought the “Fear Index” to some of its lowest levels in the past seven years. Fortunately, the stock market continues to hold up well, and the S&P 500 reached an all-time high close on Wednesday. We edged out the previous high close of December 31 by 0.00108%.
The economic news continues to be mostly positive, with a few bumps. This week, the Federal Reserve released its Beige Book report, which looks at regional economies across the country. The reports were mostly good, and I think we can expect more tapering when the Fed meets again at the end of this month. Janet Yellen officially becomes the new Fed Chairman on February 1.
This past Tuesday, the Census Bureau released the December retail-sales report, which showed an increase of 0.2%. December is obviously a huge month for retail. While the report wasn’t outstanding, economists were expecting a gain of 0.1%. Also, the big increase for November was revised downward from 0.7% growth to 0.4%.
These are important numbers because consumers drive most of the economy. Also, retail stocks have been hit hard this year. I still like our Buy List retailers, Ross Stores ($ROST) and Bed Bath & Beyond ($BBBY). However, their most recent quarterly reports included sales through November, and not the holiday season. Once the dust settles in the retail sector, I expect our stocks to flourish.
Of course, it’s still very early, but our Buy List is already slightly ahead of the S&P 500 this year. We’ve done that despite a horrible start for Bed Bath & Beyond, which is now down over 16% for the year. Ouch! The lesson here is that diversification works. I should also note that you’ll often see the worst stock in your portfolio dropping more than the gain from your best stock. Stock performance tends to be asymmetrical. In plain English, the bad ones are worse than the best are good. That’s a key insight, and ultimately, it’s what makes value investing so effective. Now let’s look at Wells Fargo.
Wells Fargo Is a Buy up to $50 per Share
On Tuesday, Wells Fargo ($WFC) reported fourth-quarter earnings of $1 per share. That beat Wall Street’s consensus by two cents per share. Strangely, the shares initially dropped after the earnings report (yep, we know how melodramatic traders can be). Then on Wednesday, it was as if rationality and math suddenly dawned on everyone, and the nervous traders got squeezed out. Before the closing bell, WFC had rallied to a new 52-week high.
Lesson: Don’t trust the market’s first reaction. Actually, keep a wary eye on the second and third ones as well.
Now that I’ve had a chance to look at the earnings from Wells, I can say that I’m impressed. Net income for Q4 rose 10% over last year’s Q4. For the entire year, Wells’s net income rose 16% to $21.9 billion. This was their fifth-straight record year. Last year, Wells made more money than JPMorgan Chase (sorry, Jamie).
I was particularly impressed with the efforts of CEO John Stumpf and his team to trim overhead. (Notice how good companies don’t wait to cut costs; they’re always looking for excess fat they can cut.) Quarterly revenue dropped 6% to $20.7 billion. For banks, you want to see where their “efficiency ratio” is. That’s a good measure of how well they’re managing their operations. For Wells, their efficiency ratio actually ticked up a bit last quarter. That’s not bad, coming in the wake of lower revenue.
Wells’s mortgage-originations business got shellacked last quarter, but there wasn’t much they could do about that. In that sector, you’re at the mercy of the Mortgage Rate Gods. On the plus side, Wells’s wealth and brokerage business did very well. One big benefit for Wells is that they don’t have the legal bills that many of the other big banks have.
I like Wells Fargo a lot. The bank is going for less than 11 times this year’s earnings estimate. I expect another dividend increase this spring. This week, I’m raising my Buy Below on WFC to $50 per share.
Next Week’s Buy List Earnings Reports
Next Tuesday, two of our big tech stocks, IBM and CA Technologies, report earnings. I want to warn you ahead of time that IBM ($IBM) may fall below expectations. The Street expects $5.99 per share, which could be just a bit too high. I’ll tell you ahead of time not to worry about a slight earnings miss. New additions to our Buy List are often dented merchandise, and Wall Street bears have been out to get IBM. They may not be done just yet. Either way, IBM is a solid value at this price. My take: IBM is a good buy anytime you see it below $195 per share.
Three months ago, CA Technologies ($CA), the shy kid, blew the doors off its earnings report. CA netted 86 cents per share for Q3, which was 13 cents more than estimates. Wall Street expects 71 cents for Q4, which is probably a wee bit too low. There’s also a chance that CA might sweeten its quarterly dividend. CA Technologies remains a solid buy up to $35 per share. I have much love for CA.
Wednesday: Earnings from Stryker and eBay
On Wednesday, we get earnings reports from Stryker and eBay. If you recall, Stryker ($SYK) raised its dividend by 15% last month. The company missed earnings by two cents in its last report. That was mostly due to currency effects, and I said not to worry about SYK. Indeed, the stock just hit another 52-week high. This time around, Wall Street expects $1.22 per share in earnings, but I’m more interested in what they’ll have to say about 2014. Wall Street currently expects full-year earnings of $4.56 per share for 2014. Stryker remains a very good buy up to $79 per share.
eBay ($EBAY)’s earnings tend to be very consistent. So far this year, their earnings are up 14%. If we apply a 14% increase over the Q4 earnings from 2012 (70 cents per share), that gives us 80 cents per share, which is, not surprisingly, exactly what Wall Street expects. eBay is a very good buy up to $58 per share.
Thursday: Earnings from McDonald’s and Microsoft
On Thursday, we get two more blue-chip earnings reports: McDonald’s and Microsoft.
Three months ago, Microsoft ($MSFT) surprised a lot of folks on Wall Street with an outstanding earnings report. The software giant earned 62 cents per share, which was eight cents more than estimates. Sales rose 16% to $18.5 billion. Microsoft generated sales that were $700 million more than expectations. I think people forget that MSFT is a very profitable company, especially with its business clientele. For the December quarter, the expectation is for MSFT to earn 68 cents per share, which is down from 76 cents the year before. That sounds about right. We should remember that in September, MSFT raised its dividend by 22%. Microsoft is very attractive below $40 per share.
Like IBM, McDonald’s ($MCD) has been rather sluggish lately. This one may take some time before we see solid results. The consensus on the Street is for earnings of $1.39, which is only one penny more than last year’s Q4. The burger giant is coming off a lackluster year, but you should never count Ronald and his friends out. McDonald’s is a good buy up to $102 per share.
That’s all for now. The stock market will be closed on Monday in honor of Dr. Martin Luther King’s 85th Birthday. Next week will be all about earnings. In fact, there’s not much in the way of economic reports. An important note: With these earnings reports, we want to pay attention to forward guidance as much as to the actual results. I think a lot of traders are nervous about this year, especially with the Fed’s tapering plans, so any optimism from companies will go a long way. Be sure to keep checking the blog for daily updates. I’ll have more market analysis for you in the next issue of CWS Market Review!
– Eddy
-
Morning News: January 17, 2014
Posted by Eddy Elfenbein on January 17th, 2014 at 6:30 amU.K. Retail Sales Exceed Forecasts With 2.6% Christmas Surge
RBS to Face Review of Business Lending by External Consultants
Advocates for Workers Raise the Ire of Business
Bernanke Likens 2008 Financial Crisis to Car Crash
Numerous Retailers Said Hit by Data Hacking Attacks
Best Buy Reports Disappointing Holidays; Stock Dives
Shell Warns of “Significant” Profit Miss
AmEx Posts Higher 4Q Profit, Revenue
Taiwanese PC maker Acer Q4 Loss Worse than Expected at $245 Million
IBM Commits $1.2 Billion to Cloud Stack
Goldman Sachs Shares Decline as Trading Revenue Drops
Why People Love Working at Goldman Sachs—It’s Not Just the Money
Nu Skin’s Big Strategic Mistake
Joshua Brown: Tonight’s Must-Read: Howard Marks’ Memo on Luck
Cullen Roche: The Most Interesting Aspect of Bitcoin as Money…
Be sure to follow me on Twitter.
-
Spotting a Turnaround
Posted by Eddy Elfenbein on January 16th, 2014 at 2:25 pmWhen you’re a value investor, you often look at stocks that are far off their highs. The problem is that a stock that’s down only means it’s down from where it was, and not necessarily where it ought to be.
The thing with business is that turnarounds are very, very hard. Yes, they happen, but it ain’t easy. Business isn’t like sports where a team that’s leading will play very conservatively, and a trailing team has a shot of getting back in it. In business, success often breeds success (though it can breed complacency as well). Imagine a basketball game where the team that makes a basket gets to take the ball out again. That’s the business world.
J.C. Penney ($JCP) has gotten crushed lately and the company is in a world of hurt. So does that means it’s a value? Possibly, but I’m staying away. Target ($TGT), on the other hand, is down as well, but I like Target a lot more (though I’m not willing to call it a buy just yet).
Here’s the important lesson: There are some key differences between a stock that’s down (like JCP), and a stock that’s down and could be a good buy (like TGT). For me, the first sign is looking at the dividend. JCP doesn’t pay one but TGT does. That’s a major distinction. The second is cash flow. JCP is hemorrhaging money. They’ve been losing money, are losing money and will most likely continue to lose money for some time.
Target, meanwhile, is in rough shape but it’s making money — more dollars are coming in than are going out. Their earnings this fiscal year will be down from a year ago. What happens next year, however, is a question mark. If the company resumes its growth rate, it’s very likely that Target is a very good buy here.
So remember that just because a stock is down doesn’t mean it’s a good buy. You need to look for key anchors like cash flow and dividends to tell you if the decline is (probably) transitory.
-
Archives
- June 2026
- May 2026
- April 2026
- March 2026
- February 2026
- January 2026
- December 2025
- November 2025
- October 2025
- September 2025
- August 2025
- July 2025
- June 2025
- May 2025
- April 2025
- March 2025
- February 2025
- January 2025
- December 2024
- November 2024
- October 2024
- September 2024
- August 2024
- July 2024
- June 2024
- May 2024
- April 2024
- March 2024
- February 2024
- January 2024
- December 2023
- November 2023
- October 2023
- September 2023
- August 2023
- July 2023
- June 2023
- May 2023
- April 2023
- March 2023
- February 2023
- January 2023
- December 2022
- November 2022
- October 2022
- September 2022
- August 2022
- July 2022
- June 2022
- May 2022
- April 2022
- March 2022
- February 2022
- January 2022
- December 2021
- November 2021
- October 2021
- September 2021
- August 2021
- July 2021
- June 2021
- May 2021
- April 2021
- March 2021
- February 2021
- January 2021
- December 2020
- November 2020
- October 2020
- September 2020
- August 2020
- July 2020
- June 2020
- May 2020
- April 2020
- March 2020
- February 2020
- January 2020
- December 2019
- November 2019
- October 2019
- September 2019
- August 2019
- July 2019
- June 2019
- May 2019
- April 2019
- March 2019
- February 2019
- January 2019
- December 2018
- November 2018
- October 2018
- September 2018
- August 2018
- July 2018
- June 2018
- May 2018
- April 2018
- March 2018
- February 2018
- January 2018
- December 2017
- November 2017
- October 2017
- September 2017
- August 2017
- July 2017
- June 2017
- May 2017
- April 2017
- March 2017
- February 2017
- January 2017
- December 2016
- November 2016
- October 2016
- September 2016
- August 2016
- July 2016
- June 2016
- May 2016
- April 2016
- March 2016
- February 2016
- January 2016
- December 2015
- November 2015
- October 2015
- September 2015
- August 2015
- July 2015
- June 2015
- May 2015
- April 2015
- March 2015
- February 2015
- January 2015
- December 2014
- November 2014
- October 2014
- September 2014
- August 2014
- July 2014
- June 2014
- May 2014
- April 2014
- March 2014
- February 2014
- January 2014
- December 2013
- November 2013
- October 2013
- September 2013
- August 2013
- July 2013
- June 2013
- May 2013
- April 2013
- March 2013
- February 2013
- January 2013
- December 2012
- November 2012
- October 2012
- September 2012
- August 2012
- July 2012
- June 2012
- May 2012
- April 2012
- March 2012
- February 2012
- January 2012
- December 2011
- November 2011
- October 2011
- September 2011
- August 2011
- July 2011
- June 2011
- May 2011
- April 2011
- March 2011
- February 2011
- January 2011
- December 2010
- November 2010
- October 2010
- September 2010
- August 2010
- July 2010
- June 2010
- May 2010
- April 2010
- March 2010
- February 2010
- January 2010
- December 2009
- November 2009
- October 2009
- September 2009
- August 2009
- July 2009
- June 2009
- May 2009
- April 2009
- March 2009
- February 2009
- January 2009
- December 2008
- November 2008
- October 2008
- September 2008
- August 2008
- July 2008
- June 2008
- May 2008
- April 2008
- March 2008
- February 2008
- January 2008
- December 2007
- November 2007
- October 2007
- September 2007
- August 2007
- July 2007
- June 2007
- May 2007
- April 2007
- March 2007
- February 2007
- January 2007
- December 2006
- November 2006
- October 2006
- September 2006
- August 2006
- July 2006
- June 2006
- May 2006
- April 2006
- March 2006
- February 2006
- January 2006
- December 2005
- November 2005
- October 2005
- September 2005
- August 2005
- July 2005
 Eddy Elfenbein is a Washington, DC-based speaker, portfolio manager and editor of the blog Crossing Wall Street. His