-
Stocks Retreat After No Deal Is Reached
Posted by Eddy Elfenbein on October 14th, 2013 at 9:54 amI’m back in the office after a long stretch of travel. The stock market is giving back some of the big gains it took on Thursday and Friday. The S&P 500 jumped back over 1,700 on Friday, and now we’re back down to 1,692.73, which is a drop of about 0.6%. That’s not much, but we’ve been noticeably more volatile than usual.
The latest news is that the politicians are having difficulty trying to end this absurd stalemate. Clearly, the market wants this to end soon.
On Friday, both of our big banks, Wells Fargo (WFC) and JPMorgan Chase (JPM), reported earnings. Wells earned 99 cents per share which was two cents ahead of expectations. Shares of WFC dropped sharply early on during Friday’s trading, but regained their composure and closed the day down by just one penny per share.
On the other hand, JPMorgan reported a loss for the quarter thanks to a fortune going towards legal costs. Excluding that, the bank earned $1.42 per share which was 24 cents more than expectations. I actually thought it could be even higher. Remarkably, JPM also closed lower on Friday by one penny per share.
Many of our Buy List stocks continue to do very well. On Friday, AFLAC (AFL) got to a new 52-week high. Cognizant Technology (CTSH) nearly broke $89 per share. In late June, it was near $60 per share. CTSH was helped on Friday when Infosys beat expectations.
-
Morning News: October 14, 2013
Posted by Eddy Elfenbein on October 14th, 2013 at 6:32 amIndia Inflation Rises to 7-Month High
China Inflation At Seven-Month High, Limits Room For Easing Despite Export Tumble
Yen Rises, Investors Seek Shelter From US Debt Worries
IMF’s Christine Lagarde Warns America’s Lawmakers They Risk Tipping World Into Recession
World Keeps Full Faith in U.S. Treasuries If Not Politics
Spending Dispute Leaves a Senate Deal Elusive
U.S. Shutdown Blinds Oil Markets
WTI Climbs as China Oil Import Jumps; Debt Talks Continue
Saudi Aramco Plans ‘Massive’ Spending to Extend Field Life
Activision Gains Autonomy From Vivendi as Deal Completes
Alibaba To Transform China’s ‘E-Conomy’ With $500 Billion Marketplace
Netflix in talks with U.S. cable companies: WSJ
GOLDMAN: Government Shutdown Could Shave 0.5% Of Q4 GDP
Roger Nusbaum: Saving Is For Suckers!
Weighing the Week Ahead: An End to the Debt Limit Stalemate?
Be sure to follow me on Twitter.
-
Wells Fargo’s Quarterly Profit Jumps
Posted by Eddy Elfenbein on October 11th, 2013 at 11:42 amWells Fargo ($WFC) announced earnings this morning. From Reuters:
Profit at Wells Fargo & Co (WFC.N) rose by a better-than-expected 13 percent in the third quarter, as the largest U.S. mortgage lender made up for a decline in that business by releasing a large chunk of money it had set aside for bad loans.
Home refinancings, which had boosted profits at Wells Fargo, the fourth-largest U.S. bank, over the past few quarters, slowed as anticipated, and many of its 89 other businesses did not improve enough to pick up the slack.
An improving economy meant more people paid their bills and the bank was able to release $900 million of reserves for credit losses, its largest since the second quarter of 2011. Lower write-offs of bad loans and lower personnel expenses also boosted profits, it said on Friday.
Net income applicable to common shareholders rose to $5.32 billion, or 99 cents per share, from $4.72 billion, or 88 cents per share, a year earlier. Analysts, on average, estimated Wells Fargo would earn 97 cents per share, according to Thomson Reuters I/B/E/S.
Wells Fargo shares were down 1.3 percent at $40.89 in early trading.
The bank made $80 billion in home loans, down from $139 billion a year earlier. That marked the smallest amount of mortgages that Wells Fargo extended since the second quarter of 2011, when it made $64 billion. It also ended a streak of seven consecutive quarters making over $100 billion in home loans.
Mortgage banking income fell 43 percent to $1.61 billion due to fewer loans as well as diminished profit from selling mortgages to investors. Within the business, income from collecting payments on mortgages rose by over $300 million to $507 million, while income from the business of making new loans fell by $1.5 billion to $1.1 billion.
The profitability of selling mortgages fell to 1.42 percent from 2.21 percent in both the third quarter of 2012 and the second quarter of 2013. The bank had expected the margin to fall to about 1.5 percent.
Rising interest rates crimped customer demand for mortgages throughout the quarter. In early September, applications to refinance home loans fell to their lowest level since November 2008.
For the week ended September 27, 30-year mortgage rates fell to 4.49 percent from 4.8 percent in the week ended August 23, after the U.S. Federal Reserve opted not to curtail its bond-buying program on September 18, but there was little sign that Wells Fargo would immediately benefit.
The bank had $35 billion in mortgage applications that it had received but not yet processed at quarter-end, compared with $63 billion at the end of the second quarter.
Higher revenues from other businesses helped to offset some of the decline in mortgage banking. Trust and investment fees rose to $3.28 billion from $2.95 billion a year earlier.
Wells Fargo’s net interest margin, a measure of how profitable its loans are, fell to 3.38 percent from 3.66 percent in the same quarter last year and 3.46 percent in the second quarter. An increase in deposits and long-term debt was responsible for 75 percent of the decrease from the prior quarter.
Total revenue dipped to $20.5 billion from $21.2 billion a year earlier, meaning that the higher profits were achieved though cost savings and reserve releases.
The bank announced layoffs of about 5,300 employees in its mortgage operation throughout the third quarter.
The stock opened at $40.44 and is up slightly from there in mid-day trading.
-
JPMorgan Reports Dimon’s First Loss on a Legal Charge
Posted by Eddy Elfenbein on October 11th, 2013 at 11:35 amJPMorgan ($JPM) released earnings this morning. From Bloomberg:
JPMorgan Chase & Co. (JPM) reported its first loss under Chief Executive Officer Jamie Dimon after taking a $7.2 billion charge to cover the cost of mounting litigation and regulatory probes.
The third-quarter loss was $380 million, or 17 cents a share, compared with a profit of $5.71 billion, or $1.40, a year earlier, the New York-based company said today in a statement. Shares of the company rose 2.6 percent at 7:50 a.m. after profit adjusted for one-time items beat analysts’ estimates.
Dimon, 57, who led JPMorgan to record earnings in each of the past three years, is grappling with regulatory investigations and tightening internal controls following its more than $6.2 billion trading loss last year. The legal costs contributed to a 54 percent surge in non-interest expenses to $23.6 billion, as revenue dropped 8 percent from a year earlier.
“In this highly charged and unpredictable environment, with escalating demands and penalties from multiple government agencies, we thought it was prudent to significantly strengthen” the bank’s legal reserves, Dimon said in the statement. “While we expect our litigation costs should abate and normalize over time, they may continue to be volatile over the next several quarters.”
JPMorgan rose to $53.90 in New York trading from $52.52 at the close yesterday. Earnings adjusted for one-time items were $1.42 a share, exceeding the $1.30 average estimate of 20 analysts surveyed by Bloomberg.
At mid-day trading, the stock is only slightly down from the morning’s open at $52.96.
-
CWS Market Review – October 11, 2013
Posted by Eddy Elfenbein on October 11th, 2013 at 7:04 am“Successful investing is anticipating the anticipations of others.”
– John Maynard KeynesSo we’ve reached the point that when our politicians decide against committing economic suicide, it’s celebrated as good news.
On Thursday we learned that our government may have side-stepped a wholly self-induced crisis. The S&P 500 responded with its biggest rally since the first day of the year. (Interestingly, the rally that occurred nine months ago was itself due to a deal to avert another self-induced crisis—the Fiscal Cliff.)
With this deal, nothing is finalized as of yet, but the Obama Administration has endorsed a short-term increase to the debt limit with zero policy conditions. This gives us one more month before default, and hopefully another month to get a longer-lasting deal together. Apparently, folks in Washington finally got the clue that equity markets were, shall we say, not pleased.

In this week’s CWS Market Review, we’ll take a closer look at the market’s recent turmoil. Actually, compared with the mayhem from two years ago, the stock and bond markets have been downright mellow. Or at least as mellow as traders can get. I’ll also preview one of our upcoming Buy List earnings reports. I’m expecting another strong season for our stocks. But first, let’s look at the market’s best day in nine months.
Despite the Drama, the Markets Are Calm
In last week’s CWS Market Review, I wrote that the White House and Congress would eventually reach some sort of deal simply because there was too much to lose if they couldn’t come together. I realize, of course, that one always is at risk of overestimating the maturity of our political class.
I should add that this potential deal still doesn’t address the government shutdown, which is particularly irksome for stat-heads like myself, since several important economic reports have been delayed. It’s impossible to say what the impact of the government shutdown is when we can’t even get the reports about what the economy did last month.
Economists generally estimate that the government shutdown will shave a bit off Q4 GDP. The longer it lasts, the more it will be. Speaker Boehner’s plan would push the Default Day from October 17 to November 22 (incidentally, the 50th anniversary of the Kennedy Assassination). Technically, that would be the end of Uncle Sam’s borrowing authority.
Thursday’s jobless claims report showed a spike of 66,000. But a lot of that was due to California catching up on its big backlog of claims. If you recall, the previous report was very low. Since there tends to be lots of noise in these weekly reports, many analysts prefer to look at the four-week moving average.
As I mentioned before, the stock market has been surprisingly calm, despite the risks involved with the nuclear standoff game President Obama and Congress are playing. Let’s look at two good reads of the market’s jitters. First, the Volatility Index ($VIX). On Tuesday, the VIX made news when it broke 20 for the first time in more than three months. In fact, it broke 21 as well.
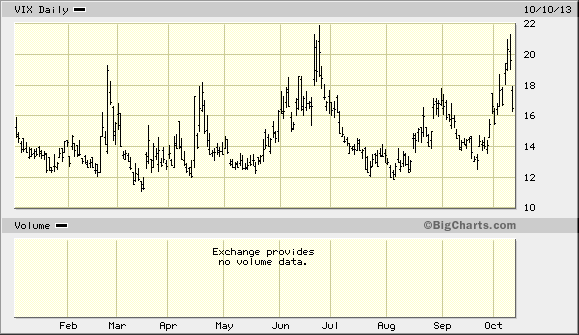
The VIX is the market’s estimate of how much stock prices will fluctuate over the next month. The greater the uncertainty, the more it’s expected stocks will bounce around. Bear in mind that volatility isn’t necessarily a bad thing. As a stock picker, I don’t mind some volatility since it means that good companies have a greater opportunity to see their stocks drop down to bargain prices.
But viewed in proper perspective, a VIX of 20 really isn’t that high. It’s just that recent volatility has been so low. Last quarter, the S&P 500 had an average daily volatility of just 0.45%, which was a seven-year low. The S&P 500’s close on Tuesday was 4% below the all-time high close from a few weeks ago. In 2011, the market fell nearly 20%.
(Geeky math interlude: If you’re curious as to what exactly the VIX measures, it’s the market’s estimate for the S&P 500’s volatility over the next 30 days. The number is annualized, so we can get it down to one month by dividing the VIX by the square root of 12, which is roughly 3.46. That gives us the market’s one-standard-deviation estimate for the S&P 500’s plus/minus range for the next month.)
Let’s take a step back and remember that during the last Debt Ceiling fight two years ago, the VIX came near 50. During the height of the Financial Crisis, the VIX topped 80. Traders are nervous today over a 20 VIX. The VIX was above 20 almost continuously for five straight years during the late 1990s and early 2000s. The stock market is far calmer today.
Thanks to the news of a potential Debt Ceiling deal, the VIX plunged 16% on Thursday, to 16.48. Interestingly, the Dow almost perfectly bounced off its 200-day moving average on Wednesday (see the top chart). The index hasn’t closed below its 200-DMA all year. The S&P 500 is still well above its 200-DMA. Bespoke Investment Group noted that the stocks that did the best on Thursday were the ones that had been punished the most the week before. This was a classic snap-back rally.
I also wanted to touch on the surprising surge in the one-month Treasury bill yield. In September, the one-month yield dropped down to 0.0%. This means you got absolutely nothing for lending Uncle Sam your money for one month. But in the last few days, the one-month yield has jumped up to 0.25%. This is another event that’s gotten a lot of attention, but ultimately it doesn’t mean much. Some market participants are obviously speculating on a default. Since the rest of the yield curve hasn’t moved much, we can see that it’s mostly a short-term game. I think traders will dump this position (meaning, cover their shorts) very soon and very dramatically. As with the VIX, the rise is only dramatic when seen in the context of the very low yields we’ve had for a long time.
Janet Yellen to Be the Next Fed Chair
The other big news was that President Obama nominated Janet Yellen to be the next head of the Federal Reserve. This wasn’t much of a surprise, especially since Larry Summers withdrew his name from consideration. The market clearly likes Yellen, and she’s well-respected on Wall Street.
I don’t have much to add except that I think it’s a mistake to view Yellen as an automatic vote for the inflation doves. Right now she’s with the doves, but she hasn’t always been. In the 1990s, she was much more wary of lowering interest rates too quickly. I think some people on Wall Street aren’t aware of that. I also hope that she continues Bernanke’s policy of bringing more openness and transparency to the Federal Reserve.
Speaking of which, the Fed released the minutes from its September meeting. This is the now-famous meeting when the central bank surprised us all by deciding not to taper (for now). The market rallied on the no-taper news, and that day (September 18) marked the S&P 500’s current all-time high close. The minutes from September indicate that most FOMC members think the Fed will begin tapering its bond-buying program before the end of the year. That’s a bit of a surprise.
The Fed will meet two more times this year, once at the end of this month and again in December, just before Christmas. I think the latter meeting will probably see the first announcement of scaling back their bond purchases. But if the economic data are weak, then all bets are off.
Stryker Is a Buy up to $71 per Share
It appears that Stryker ($SYK) will be our only Buy List stock reporting earnings next week. There may be others, but none that I can confirm just yet. The week after next, several more should report. Stryker is due to report Q3 earnings after the market’s close on Thursday, October 17. Wall Street currently expects $1 per share, which is a small increase over the 97 cents per share from one year ago.
I like Stryker a lot, but I was surprised by a rate earnings miss three months ago. The company also lowered its full-year guidance from $4.25 to $4.40 per share to a range of $4.20 to $4.26 per share. The problem is that they’ve been getting squeezed on currency exchange. That’s troubling, but the important thing is that it’s not due to operations.
Stryker made news recently when they bought MAKO Surgical ($MAKO) for $1.65 billion, which was an 86% premium. That’s a hefty price tag, but MAKO is involved in robotic-assisted surgery, which is a red hot sector. I’m skeptical of this move, but I’ll give SYK the benefit of the doubt. I also expect to see a dividend increase in December. Stryker remains a very good buy up to $71 per share.
That’s all for now. Earnings season heats up next week. I have no idea what economic reports will come out next week. I can say that CPI and Industrial Production are two reports that I’d very much like to see…that is, if the government ever reopens. Also on Thursday, Stryker will report Q3 earnings. Be sure to keep checking the blog for daily updates. I’ll have more market analysis for you in the next issue of CWS Market Review!
– Eddy
-
Morning News: October 11, 2013
Posted by Eddy Elfenbein on October 11th, 2013 at 7:02 amIMF Wants Central Banks to Oversee Markets With Gov’t Supervision
Royal Mail Stock Jumps 38% on First Trading Day After IPO
France’s Fracking Ban ‘Absolute’ After Court Upholds Law
Middle East Oil Fuels Fresh China-U.S. Tensions
G20 Hopes Grow for U.S. Deal to Avert Default
Republicans Enter Talks With Obama on Debt Limit Increase
Starbucks CEO Starts Petition Against Government Shutdown
Blue Cross Plans Jump to an Early Lead
BlackBerry Co-founders Considering Bid for Company
Del Monte Pacific Buys U.S. Canned Food Business for $1.7 Billion
Here’s What Brokerages Have to Say About Infosys Q2 Results
Safeway Third-quarter Profit Down
Credit Writedowns: First Signs That U.S. Shutdown is Impacting Consumer Spending
Roger Nusbaum: True Understanding of the Long Term
Be sure to follow me on Twitter.
-
Morning News: October 10, 2013
Posted by Eddy Elfenbein on October 10th, 2013 at 6:49 amDraghi’s Next Move Seen Easing Liquidity as Rates on Hold
Abenomics is a Gigantic Headache for the World’s Largest Pension Fund
China’s Ambassador to Myanmar Stresses Communication
Currency Volatility in India Brings Down PC Shipments in APAC
For Janet Yellen, Obama’s Federal Reserve Nominee, Quiet Patience Paid Off
The Yellen Fed? Precise and Predictable
Budget Stalemate Could End Talk of the Fed Tapering Its Stimulus
Tracing the Calendar Down to the Last Cent
Washington Budget Chaos Keeps Fed Rates Low for Longer
Rejection Rebound? Men’s Wearhouse Up 28% After Refusing Jos. A. Bank’s $2.3 Billion Offer
Morgan Stanley Sees Gold Lower in 2014 as Goldman Says Sell
JPMorgan Clients in Cash as Schwab’s Options Hedge Default
Check Out What’s Happened To The Windows PC Market Since Apple Launched The iPad
Jeff Carter: 95% of the Time, I Am Selling
Joshua Brown: A Tale of Two Dows (Or Why We invest Globally)
Be sure to follow me on Twitter.
-
Travel Week
Posted by Eddy Elfenbein on October 10th, 2013 at 2:01 amI have to apologize. I’ve been traveling this week and haven’t had much time to post. I hope to bring you full analysis and market news in this Friday’s CWS Market Review.
-
Morning News: October 9, 2013
Posted by Eddy Elfenbein on October 9th, 2013 at 6:31 amIndia September Trade Deficit Narrows to 30-Month Low
IMF’s Pessimism on Global Growth Widens
Yellen’s Quake-Proof Calm Needed to Guide Fed Easing Exit
Recession Looms If Treasury Uses Tools to Prevent a Debt Default
Bharti, Walmart Call Off India JV; to Independently Pursue Retail Business
Alcoa Reports Profitable Quarter on Lower Costs
Microsoft’s $7.2 Billion Nokia Bet Not Luring Apps
The Worst Is Over for Yum! Brands
Panasonic Said to Halt Plasma TV Output This Fiscal Year
Jos. A. Bank Proposes to Buy Men’s Wearhouse for $2.3 billion
New Stock Symbol for Tweeter After Twitter Mix-Up
Take That, Counterfeiters: One Hundred Years of Changes to the $100 Bill
Cullen Roche: Meet Your New Monetary Overlord, Janet Yellen
Credit Writedowns: In the Event of a Missed Payment, the U.S. Has Three Days to Cure
Be sure to follow me on Twitter.
-
On the Road…
Posted by Eddy Elfenbein on October 8th, 2013 at 9:57 amLight posting today. It’s a travel day.
-
Archives
- August 2026
- July 2026
- June 2026
- May 2026
- April 2026
- March 2026
- February 2026
- January 2026
- December 2025
- November 2025
- October 2025
- September 2025
- August 2025
- July 2025
- June 2025
- May 2025
- April 2025
- March 2025
- February 2025
- January 2025
- December 2024
- November 2024
- October 2024
- September 2024
- August 2024
- July 2024
- June 2024
- May 2024
- April 2024
- March 2024
- February 2024
- January 2024
- December 2023
- November 2023
- October 2023
- September 2023
- August 2023
- July 2023
- June 2023
- May 2023
- April 2023
- March 2023
- February 2023
- January 2023
- December 2022
- November 2022
- October 2022
- September 2022
- August 2022
- July 2022
- June 2022
- May 2022
- April 2022
- March 2022
- February 2022
- January 2022
- December 2021
- November 2021
- October 2021
- September 2021
- August 2021
- July 2021
- June 2021
- May 2021
- April 2021
- March 2021
- February 2021
- January 2021
- December 2020
- November 2020
- October 2020
- September 2020
- August 2020
- July 2020
- June 2020
- May 2020
- April 2020
- March 2020
- February 2020
- January 2020
- December 2019
- November 2019
- October 2019
- September 2019
- August 2019
- July 2019
- June 2019
- May 2019
- April 2019
- March 2019
- February 2019
- January 2019
- December 2018
- November 2018
- October 2018
- September 2018
- August 2018
- July 2018
- June 2018
- May 2018
- April 2018
- March 2018
- February 2018
- January 2018
- December 2017
- November 2017
- October 2017
- September 2017
- August 2017
- July 2017
- June 2017
- May 2017
- April 2017
- March 2017
- February 2017
- January 2017
- December 2016
- November 2016
- October 2016
- September 2016
- August 2016
- July 2016
- June 2016
- May 2016
- April 2016
- March 2016
- February 2016
- January 2016
- December 2015
- November 2015
- October 2015
- September 2015
- August 2015
- July 2015
- June 2015
- May 2015
- April 2015
- March 2015
- February 2015
- January 2015
- December 2014
- November 2014
- October 2014
- September 2014
- August 2014
- July 2014
- June 2014
- May 2014
- April 2014
- March 2014
- February 2014
- January 2014
- December 2013
- November 2013
- October 2013
- September 2013
- August 2013
- July 2013
- June 2013
- May 2013
- April 2013
- March 2013
- February 2013
- January 2013
- December 2012
- November 2012
- October 2012
- September 2012
- August 2012
- July 2012
- June 2012
- May 2012
- April 2012
- March 2012
- February 2012
- January 2012
- December 2011
- November 2011
- October 2011
- September 2011
- August 2011
- July 2011
- June 2011
- May 2011
- April 2011
- March 2011
- February 2011
- January 2011
- December 2010
- November 2010
- October 2010
- September 2010
- August 2010
- July 2010
- June 2010
- May 2010
- April 2010
- March 2010
- February 2010
- January 2010
- December 2009
- November 2009
- October 2009
- September 2009
- August 2009
- July 2009
- June 2009
- May 2009
- April 2009
- March 2009
- February 2009
- January 2009
- December 2008
- November 2008
- October 2008
- September 2008
- August 2008
- July 2008
- June 2008
- May 2008
- April 2008
- March 2008
- February 2008
- January 2008
- December 2007
- November 2007
- October 2007
- September 2007
- August 2007
- July 2007
- June 2007
- May 2007
- April 2007
- March 2007
- February 2007
- January 2007
- December 2006
- November 2006
- October 2006
- September 2006
- August 2006
- July 2006
- June 2006
- May 2006
- April 2006
- March 2006
- February 2006
- January 2006
- December 2005
- November 2005
- October 2005
- September 2005
- August 2005
- July 2005
 Eddy Elfenbein is a Washington, DC-based speaker, portfolio manager and editor of the blog Crossing Wall Street. His